. 2006 Jan 1;90(1):228-37.
doi: 10.1529/biophysj.105.067066. Epub 2005 Oct 7.

Lipid asymmetry in DLPC/DSPC-supported lipid bilayers: a combined AFM and fluorescence microscopy study

Affiliations

Lipid asymmetry in DLPC/DSPC-supported lipid bilayers: a combined AFM and fluorescence microscopy study

Wan-Chen Lin et al. Biophys J. .

Abstract

A fundamental attribute of cell membranes is transmembrane asymmetry, specifically the formation of ordered phase domains in one leaflet that are compositionally different from the opposing leaflet of the bilayer. Using model membrane systems, many previous studies have demonstrated the formation of ordered phase domains that display complete transmembrane symmetry; but there have been few reports on the more biologically relevant asymmetric membrane structures. Here we report on a combined atomic force microscopy and fluorescence microscopy study whereby we observe three different states of transmembrane symmetry in phase-separated supported lipid bilayers formed by vesicle fusion. We find that if the leaflets differ in gel-phase area fraction, then the smaller domains in one leaflet are in registry with the larger domains in the other leaflet and the system is dynamic. In a presumed lipid flip-flop process similar to Ostwald ripening, the smaller domains in one leaflet erode away whereas the large domains in the other leaflet grow until complete compositional asymmetry is reached and remains stable. We have quantified this evolution and determined that the lipid flip-flop event happens most frequently at the interface between symmetric and asymmetric DSPC domains. If both leaflets have identical area fraction of gel-phase, gel-phase domains are in registry and are static in comparison to the first state. The stability of these three DSPC domain distributions, the degree of registry observed, and the domain immobility have biological significance with regards to maintenance of lipid asymmetry in living cell membranes, communication between inner leaflet and outer leaflet, membrane adhesion, and raft mobility.


Figures
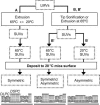
FIGURE 1
FIGURE 1
Flow chart for methods of formation of DLPC/DSPC-supported lipid bilayers. Resulting domain symmetry for each method is given at the bottom.
FIGURE 2
FIGURE 2
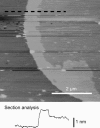
AFM images and section analyses (the dotted lines denote the location of the sections) of phase-separated supported lipid bilayers. Lighter shading represent higher surfaces. (A) Supported lipid bilayer made by Method A. The measured domain heights extend ∼1.8 nm above the surrounding DLPC fluid-phase matrix. (B) Supported lipid bilayer made by Method B′. The bilayers prepared in this manner contained domains with areas extending 1.8 nm and 1.1 nm above the surrounding DLPC matrix. (Inset) 1.8 nm domains convert into 1.1 nm domains after ∼4 h; time after supported lipid bilayer formation: left, 30 min, middle, 1.5 h, and right, 4 h. (C) Supported lipid bilayer made by Method B. The domains are ∼1.1 nm higher than the fluid-phase region.
FIGURE 3
FIGURE 3
AFM image and section analysis of an L-B-deposited supported lipid bilayer.
FIGURE 4
FIGURE 4
AFM images (AD), fluorescent images from FRAP experiments (A1D1), and cobalt-quenching experiments (A2D2) for supported lipid bilayers prepared by different methods. (A) Supported DSPC lipid bilayer doped with 2 mol % NBD-PC. (B) A supported lipid bilayer made by Method A doped with 1 mol % NBD-PC. The area fraction of gel-phase region is ∼0.79 (DSPC/DLPC molar ratio ∼70:20). (C) A supported lipid bilayer made by Method B doped with 1 mol % NBD-PC. The area fraction of the gel-phase region is ∼0.75 (DSPC/DLPC molar ratio ∼40:60). (D) Supported DLPC bilayer doped with 1 mol % NBD-PC. The top illustrates the type of supported lipid bilayer. In each FRAP experiment, images were taken after photobleaching. The original bleached spot is ∼50 μm in diameter. In the cobalt-quenching experiments, fluorescent images were taken before (left) and after (right) addition of 50 mM cobalt chloride ions in the water subphase. The measured intensity is labeled on each image. The scale bar is 10 μm unless specified.
FIGURE 5
FIGURE 5
Change in domain area of a DLPC/DSPC-supported lipid bilayer formed by Method B′ as a function of time. Open circles represent the area of DSPC symmetric domains; open squares represent the area of DSPC asymmetric domains. The total area occupied by DSPC (solid squares) is the summation of asymmetric domains and two times the symmetric domains. The dashed line represents the average value. Data shown here are average results from five 10 μm × 10 μm AFM bilayer scans.
FIGURE 6
FIGURE 6
Interface movement due to lipid flip-flop in supported lipid bilayers. (A) Time sequence images of a bilayer made by Method B′ showing the evolution of the domain structure after bilayer formation. The unit of time is an hour. We observed a fast interface movement at the interface between 1.1 nm height and 1.8 nm height (white dashed arrow; symmetric DSPC-asymmetric DSPC interface) and a slow interface movement at the interface between 0 nm height and 1.8 nm height (white solid arrow; symmetric DLPC-symmetric DSPC interface). In addition, the fast interface movement also happened when there was a fluid DLPC pool trapped within the gel domain (black arrow). (B) A histogram of interface movement for each case. Dashed lines represent the Gaussian fit of each group. The center of the Gaussian peaks located at 1.7, 36.5, and 85.3 nm/h for symmetric DLPC-symmetric DSPC interface, symmetric DSPC-asymmetric DSPC interface, and interface associated with DLPC pools, respectively.
FIGURE 7
FIGURE 7
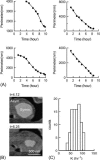
Quantifying lipid flip-flop in supported lipid bilayers formed by Method B′. (A) Measured perimeter of four symmetric DSPC domains (in asymmetric DSPC/symmetric DSPC domain structures) as a function of time. The solid line represents the polynomial fit of the data. (B) Time sequence of the type of domain used for this analysis. (C) Distribution of the rate constant K. The average value of K is 77 ± 17 h−1.

Similar articles

Cited by

References

    1. Brown, D. A., and E. London. 2000. Structure and function of sphingolipid- and cholesterol-rich membrane rafts. J. Biol. Chem. 275:17221–17224 [Review]. - PubMed
    1. Devaux, P. F., and R. Morris. 2004. Transmembrane asymmetry and lateral domains in biological membranes. Traffic. 5:241–246. - PubMed
    1. Devaux, P. F. 1991. Static and dynamic lipid asymmetry in cell membranes. Biochemistry. 30:1163–1173. - PubMed
    1. Daleke, D. L. 2003. Regulation of transbilayer plasma membrane phospholipid asymmetry. J. Lipid Res. 44:233–242. - PubMed
    1. Kornberg, R. D., and H. M. McConnell. 1971. Inside-outside transitions of phospholipids in vesicle membranes. Biochemistry. 10:1111–1120. - PubMed

Publication types

Substances