. 2006 Jan 1;90(1):24-41.
doi: 10.1529/biophysj.105.064378. Epub 2005 Oct 7.

A stochastic two-dimensional model of intercellular Ca2+ wave spread in glia

Affiliations

A stochastic two-dimensional model of intercellular Ca2+ wave spread in glia

Dumitru A Iacobas et al. Biophys J. .

Abstract

We describe a two-dimensional stochastic model of intercellular Ca(2+) wave (ICW) spread in glia that includes contributions of external stimuli, ionotropic and metabotropic P2 receptors, exo- and ecto-nucleotidases, second messengers, and gap junctions. In this model, an initial stimulus evokes ATP and UTP release from a single cell. Agonists diffuse and are degraded both in bulk solution and at cell surfaces. Ca(2+) elevation in individual cells is determined by bound agonist concentrations s and by number and features of P2 receptors summed with that generated by IP(3) diffusing through gap junction channels. Variability of ICWs is provided by randomly distributing a predetermined density of cells in a rectangular grid and by randomly selecting within intervals values characterizing the extracellular compartment, individual cells, and interconnections with neighboring cells. Variability intervals were obtained from experiments on astrocytoma cells transfected to express individual P2 receptors and/or the gap junction protein connexin43. The simulation program (available as Supplementary Material) permits individual alteration of ICW components, allowing comparison of simulations with data from cells expressing connexin43 and/or various P2 receptor subtypes. Such modeling is expected to be useful for testing phenomenological hypotheses and in understanding consequences of alteration of system components under experimental or pathological conditions.


Figures

FIGURE 1
FIGURE 1
Intercellular calcium wave (ICW) spread among 1321N1 human astrocytoma cells stably expressing P2Y2 receptors. (A) Confocal images of cells loaded with Indo 1-AM and imaged using a real-time confocal microscope (Model RCM-8000, Nikon, Tokyo, Japan) as previously described (3,31). Images were pseudo-colored using the lookup table (fluorescence ratio proportional to the logarithm of the molar concentration of Ca2+) indicated at the far left. Mechanical stimulation of a cell in the center of the field (arrow, cell a) induces a steep increase in the intracellular Ca2+ level of the stimulated cell and triggers the transmission of the Ca2+ signal to the neighboring cells (a chain of which is labeled b–d). (B) Graphical representation of the phenomenon illustrated in A as a function of time for the four cells indicated in the photograph.
FIGURE 2
FIGURE 2
The main features of the model. (A) 13 × 13 node portion of the network. In this example, cells (whose centers are illustrated by the small circles) were assigned to nodes with 80% probability. Tier 5 is represented by a circular crown of thickness equal to one internodal distance. Note the nonuniform cell density within the tier. (B) Agonist release, diffusion, binding, and degradation. The central cell (located at the node (0,0) in A) is externally stimulated with an energetically quantifiable stimulus [ɛ] and due to the independent transduction events EATP and EUTP it immediately releases single amounts of ATP (A) and UTP (U). The agonists diffuse (D = diffusion coefficient) through the solution and irreversibly bind to P2X and P2Y receptors on the cell surface (shaded; note that in this illustration only the extracellular cell surfaces are relevant). The agonist is degraded both in the solution by exo-nucleotidases (EXO) and at the membrane surface by the ecto-nucleotidases (ECTO). The first degradation product, A′ or U′, may be an additional active agonist for certain P2Rs. The next degradation step produces compounds without agonist activity, all denoted by the generic letter ä. (C) Ca2+ influx induced by ionotropic activity. Agonist binding to ionotropic P2XRs opens channels through which Ca2+ diffuses from the medium into the cell. Notations: a(m,n;t) = agonist on node (m,n) at time t, where (m,n) denotes the location of the cell in a Cartesian system centered on the stimulated cell; formula image and formula image concentrations in bulk solution, endoplasmic reticulum, and cytosol; and VSO and VCY(m,n) = volume of bulk solution and of cytosol. Basal Ca2+ concentration is restored in time by sequestration of Ca2+ ions into the ER with the rate η(m,n) and/or extrusion in the extracellular medium with the rate ψ(m,n) through the calcium-extrusion pump (CE). (D) Generation of intracellular Ca2+ pulse in cells expressing metabotropic P2YRs and in cells interconnected through gap junction channels with cells expressing P2YRs. Agonist binding to P2YRs initiates a series of intracellular reactions leading to IP3 generation. IP3 then diffuses within the cytosol and to the neighboring cells through the C(m,n;m+i,n+j) gap junction channels having the IP3 permeability Γ, releases Ca2+ from IP3-sensitive stores of the endoplasmic reticulum (ER), and is degraded within the cytosol with the rate κ(m,n). As illustrated for the cell in the upper right corner, increase in cytosolic Ca2+ can occur also in cells that lack P2 receptors if they are interconnected via gap junction channels with cells producing IP3.
FIGURE 3
FIGURE 3
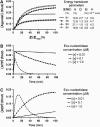
Agonist release and degradation in the solution. (A) Logistic dependence of the total amount of agonist (ATP or UTP) released instantaneously by a mechanical stimulus (ɛ) upon a cell located at node (0,0) at time 0. The stimulus is a percentage of the unknown energy ɛmax, which is the maximum intensity that can stimulate the cell without damaging it. Note that for a particular stimulus energy (ɛ/ɛmax), any changes in energy receptor parameters ({ENE} = {EATP} or {EUTP}, number of energy transducers, Θ = saturation release of agonist, M = minimum energy for agonist release, H = energy necessary to release half-maximal amount of agonist stored within the cell, Q = slope of the sigmoidal stimulus intensity-agonist release curve) greatly affect the amount of agonist released by the stimulated cell. (B and C) Timecourse of changes in the total amount of ATP (B) and ADP (C) in the system due to exo-nucleotidase activity. Note that the increase in arbitrarily set concentrations of the exo-nucleotidase [x] = 0.01, 0.1, and 1 μM speeds the degradation of ATP in the system (B) and increases the amount of generated ADP (C). Because ADP is also degraded by exo-nucleotidases, the amount of ADP in the system at any moment is smaller than the initially released amount of ATP. Input parameters for central cell stimulation: ɛ/ɛmax = 10%, {EATP} = 90, Θ(EATP,ɛ) = 5 × 10⁻¹⁸ mol s−1, H(EATP,ɛ) = 10−2ɛmax, Q(EATP,ɛ) = 1.5, L(EATP1,ɛ) = 1 s, and M(EATP,ɛ) = 10−3ɛmax; exo-nucleotidase parameters set arbitrarily as [x] = 0.01, 0.1, and 1 μM, degradation rates δ (× 103 M−1 s−1) for ATP = 5, ADP = 2.
FIGURE 4
FIGURE 4
Timecourse of changes in the concentration of (A) ATP, (B) ADP, and (C) UTP at the membrane surface of cells located in nodes (0,0), (0,1), (0,2), and (0,3). In these simulations the central cell (node 0,0) is mechanically stimulated and releases ATP and UTP. We assigned the same number of transducers for ATP ({EATP}) and UTP ({EUTP}) release and chose their activation parameters so that the ratio of the released amounts of ATP and UTP is 3:1, as observed by Lazarowski and Harden (32) (leftmost graphs in A and C). Observe the delay of the release of agonist by the stimulated cell at node (0,0) and the time necessary for the agonist to reach cells located at consecutive nodes (0,1), (0,2), and (0,3). Also illustrated is the effect of increased concentrations of ecto-nucleotidases ([z] = 0.01 and 0.1 μM) on the amount of bound agonists on cells at consecutive nodes in the grid. Input parameters are as in Fig. 3, with diffusion coefficient for ATP and ADP in the solution D = 2 × 10⁻¹⁰ m2 s−1 (56), {EATP} = {EUTP} = 80, exo-nucleotidases concentrations [x1] and [x2] = 0.01 μM, and degradation rates (× 103 M−1 s−1) for ATP = 5, ADP = 2, UTP = 4, and UDP = 1, ecto-nucleotidases [z1] = [z2] arbitrarily set as 0.01 or 0.1 μM, z1 degradation rates (× 103 M−1 s−1) ATP = 400, ADP = 350, UTP = 350, UDP = 250; and z2 degradation rates ATP = 450, ADP = 200, UTP = 400, and UDP = 100. The differences in degradation rate constants for z1 and z2 in relation to ATP and ADP are based on data described by Kukulski and Komoszynski (57) for NTPDase1 and NTPDase2.
FIGURE 5
FIGURE 5
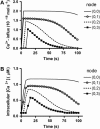
Ca2+ entry through P2X receptors. In these simulations, the time courses of Ca2+ influx (A) and cytosolic Ca2+ levels (B) due to activation of P2X4 receptors are shown for cells located in nodes (0,0), (0,1), (0,2), and (0,3). Because in this model Ca2+ influx does not promote Ca2+ release from internal stores and is actively removed from the cytosol by ER sequestration and extrusion to the extracellular medium, the kinetics of the P2X4R-mediated increase in cytosolic Ca2+ are strongly determined by those of the Ca2+ influx. Input parameters for central cell stimulation, diffusion coefficient for agonists, and nucleotidase degradation rates are the same as in Fig. 4. Amounts of ATP and UTP released = 0.47 fmol (∼98 μM ATP initial concentration at the central cell surface) and 0.15 fmol (∼32 μM UTP initial concentration at the central cell surface). Exo-nucleotidase concentration set arbitrarily as [x1] and [x2] = 0.01 μM and ecto-nucleotidases [z1] = 0.1 μM and [z2] = 0.01 μM. Number of P2X4Rs on the center stimulated cell (node 0,0) and on cells located on the other nodes was respectively fixed as 100% and 80% of the maximum number that may exist on the membrane for each cell. Other P2X4R parameters are listed in Table 2; Hill-slope Q is 1.5 and latency L is 0.5 s. Basal cytosolic and ER concentrations of [Ca2+], formula image and formula image; sequestration rate η(m,n) = 0.2 s−1; extrusion rate ψ(m,n) = 0.2 s−1.
FIGURE 6
FIGURE 6
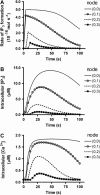
Activation of P2Y receptors. In these simulations the rate of IP3 formation (A), intracellular IP3 concentration (B), and resultant increase in cytosolic Ca2+ due to IP3-mediated Ca2+ mobilization from the ER (C) of cells located at nodes (0,0), (0,1), (0,2), and (0,3) are shown for activation of a single P2YR subtype, the P2Y2R that is sensitive to both ATP and UTP, but insensitive to ADP. For these simulations, the number of P2Y2R on each node is the same. The differences observed between IP3 formation rates, intracellular concentration, and resultant cytosolic [Ca2+] observed between cells are due to agonist diffusion and degradation by nucleotidases, resulting in different levels of P2Y2R activation. Note the temporal decrease in the rate of cellular IP3 formation (A) at each node due to decrease in receptor activation as ATP and UTP are removed from the system by nucleotidase action. Observe also how the rapid formation of IP3 leads to a steady accumulation of IP3 in the cytosol and increased [Ca2+] that reach a plateau and then decay because of decreased P2Y2R activation. Input parameters for central cell stimulation, diffusion coefficient for agonists, nucleotidase concentrations, degradation rates, and amounts of ATP and UTP released from central cell are the same as in Fig. 5. The number of P2Y2Rs on the center stimulated cell (node 0,0) and on cells located on the other nodes was respectively fixed as 100% and 80% of the maximum number that may exist on the membrane for each cell. Other P2Y2R parameters are listed in Table 2; Hill-slope Q is 1.5 and latency L is 0.5 s. We fixed the number of IP3Rs at 80% of the maximum number that may exist in the cell and the IP3 degradation rate, κ(m,n) at 0.08 s−1. Parameters for Ca2+ concentrations, extrusion, and sequestration rates are the same as in Fig. 5.
FIGURE 7
FIGURE 7
Individual and combined contribution of P2X and P2Y receptors to Ca2+ signal generation in the absence of gap-junction channels. In these simulations, the Ca2+ signals generated by activation of a particular P2R subtype (AE) are solely attributed to the properties of each receptor in relation to their agonists (saturation (Θ), half-maximal concentration (H), threshold (M), and slope (Q)). The number of P2Rs on cells located in nodes (0,0), (0,1), (0,2), and (0,3) is the same, {P2Y1,2,4} and {P2X4,7} = 80% of the maximum number that may exist on the membrane for each cell, Hill-slope Q is 1.5, and latency L is 0.5 s for all P2Rs. Note that for the same stimulation conditions and amount of agonist reaching each node (determined by diffusion and nucleotidases activity) the Ca2+ response of each cell differs according to P2R subtype present. Due to the higher sensitivity of the P2Y1Rs to ATP and also its responsiveness to ADP that is generated both in the solution and at each node from ATP degradation by nucleotidases, all cells in the simulation display Ca2+ responses with similar amplitudes (A). In the case of the P2Y2R (B) and P2Y4R (C) that are sensitive to ATP and UTP but insensitive to ADP, the nucleotidase activity restricts the range of the Ca2+ signaling as cells located farther from the center cell will be reached by smaller amounts of agonists (amplitude of the Ca2+ response decays from node (0,0) to (0,3)). The differences in Ca2+ wave spread for cells expressing the P2X4R (D) or the P2X7R (E) are due to the lower sensitivity of P2X7R to ATP, and therefore only the cells closest to the central cell respond. Part F shows Ca2+ responses in cells expressing P2Y1,2 and 4R and P2X4 and 7R. Note that although the Ca2+ amplitudes are higher than those induced by activation of single P2R subtypes (AE), they are smaller in cells located farther from the stimulated cell. Input parameters for central cell stimulation, diffusion coefficient for agonists, nucleotidase degradation rates, and amounts of ATP and UTP released from central cell are the same as in Fig. 5. Exo-nucleotidase concentration set arbitrarily as [x1] and [x2] = 0.01 μM and ecto-nucleotidases set as [z1] = 0.1 μM and [z2] = 0.01 μM. Parameters for Ca2+ concentrations, extrusion and sequestration rates are the same as in Fig. 5. Parameters for IP3R and IP3 degradation rate are the same as in Fig. 6. Parameters for P2Rs are listed in Table 2.
FIGURE 8
FIGURE 8
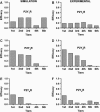
P2 receptor-mediated intercellular Ca2+ wave profiles. Simulations and experimental data obtained for intercellular Ca2+ waves (ICW) triggered by focal mechanical stimulation of the central cell (node 0,0) showing the efficacy of the Ca2+ signal spread (relative number of responding cells per tier). (A, C, and E). Efficacies of P2YR-mediated Ca2+ signaling calculated from consecutive simulations performed using parameters described in Fig. 7. All parameters, except those that characterize the P2R properties in relation to their agonists (saturation (Θ), half-maximal concentration (H), threshold (M) and slope (S)) were fixed. (B, D, and F) Experimental data obtained from P2YR-expressing 1321N1 cells (31). The figures illustrate changes in efficacies of the Ca2+ signal transmission depending on which P2YR subtype is being activated. Simulations are in agreement with experimental data as shown for ICWs mediated by P2Y1Rs, which enroll a small but uniform number of cells per tier (compare A and B), and for waves mediated by P2Y2R activation with efficacies higher in the tiers closer to the central cell and decaying as the signal spreads farther from the center (C and D). Simulated P2Y4R-mediated ICW spread also resembles that obtained experimentally and is characterized by its restricted profile, with only a small number of responding cells per tier (E and F).
FIGURE 9
FIGURE 9
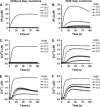
Contribution of gap-junction channels to intercellular transmission of Ca2+ waves and impact of cell coupling on P2 receptor-mediated intercellular Ca2+ wave (ICW) spread. The sole participation of gap junction channels in the spread of ICWs due to the intercellular diffusion of IP3, is illustrated in the simulations AD where P2Rs were removed from all cells with the exception of the center one (node 0,0) that express 100% of the P2Y1R subtype. Upon stimulation, the center cell responds with an increase in cytosolic IP3 (A) and Ca2+ (C) concentrations that are confined to the stimulated cell. However, in the presence of gap junction channels, the increase in IP3 concentration in the stimulated cell generates a concentration gradient between this and the neighboring coupled cells, leading to IP3 diffusion (B). Increases in IP3 concentration in the nonstimulated cells induce Ca2+ release from the ER and triggers ICW spread (D). Simulations in E and F illustrate P2YR-mediated ICW spread in the absence and presence of gap junctions, respectively; in E, cells are uncoupled and all express P2Y1Rs but with different levels, with the cells at nodes (0,2) and (0,3) expressing higher numbers of P2Y1Rs than the cell at node (0,1). In this case, the Ca2+ signals in cells located at nodes (0,2) and (0,3) peak faster than the one generated in node (0,1), creating what we have called a saltatory ICW spread (31). In the presence of gap junction channels (F), the differences in IP3 concentration levels and by consequence in Ca2+ amplitudes seen in cells expressing distinct numbers of P2Y1Rs (compare to E) are attenuated due to the diffusion of IP3 between the coupled cells. Such dissipation of large IP3 concentration gradients between cells alters the behavior of ICW, which assumes a decremental profile of spread. All parameters, with the exception of number of P2Y1Rs, are the same as in Fig. 7. The number of gap junction channels was fixed at 80% of the total number of channels that can be formed and channel permeability (Γ) was fixed at 0.6 × 10⁻¹² mol M−1 s−1.

Similar articles

Cited by

References

    1. Scemes, E. 2000. Components of astrocytic intercellular calcium signaling. Mol. Neurobiol. 22:167–179. - PubMed
    1. Dermietzel, R., Y. Gao, E. Scemes, D. Vieira, M. Urban, M. Kremer, M. V. Bennett, and D. C. Spray. 2000. Connexin43 null mice reveal that astrocytes express multiple connexins. Brain Res. Brain Res. Rev. 32:45–56. - PubMed
    1. Scemes, E., S. O. Suadicani, and D. C. Spray. 2000. Intercellular communication in spinal cord astrocytes: fine-tuning between gap junctions and P2 nucleotide receptors in calcium wave propagation. J. Neurosci. 20:1435–1445. - PMC - PubMed
    1. Boitano, S., E. R. Dirksen, and M. J. Sanderson. 1992. Intercellular propagation of calcium waves mediated by inositol trisphosphate. Science. 258:292–295. - PubMed
    1. Leybaert, L., K. Paemeleire, A. Strahonja, and M. J. Sanderson. 1998. Inositol-trisphosphate-dependent intercellular calcium signaling in and between astrocytes and endothelial cells. Glia. 24:398–407. - PubMed

Publication types

MeSH terms

LinkOut - more resources