. 2006 Jan 1;90(1):124-39.
doi: 10.1529/biophysj.105.061226. Epub 2005 Oct 7.

Ca2+ changes the force sensitivity of the hair-cell transduction channel

Affiliations

Ca2+ changes the force sensitivity of the hair-cell transduction channel

Eunice L M Cheung et al. Biophys J. .

Abstract

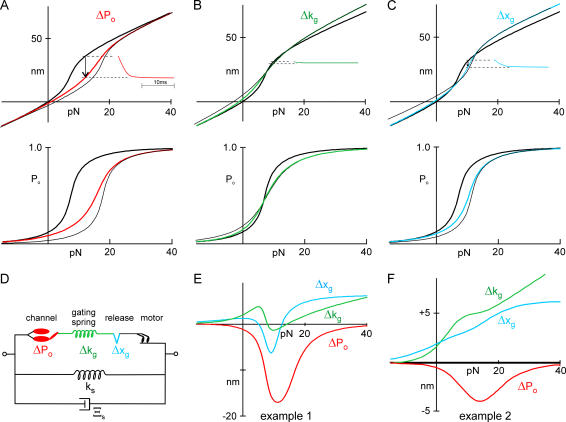
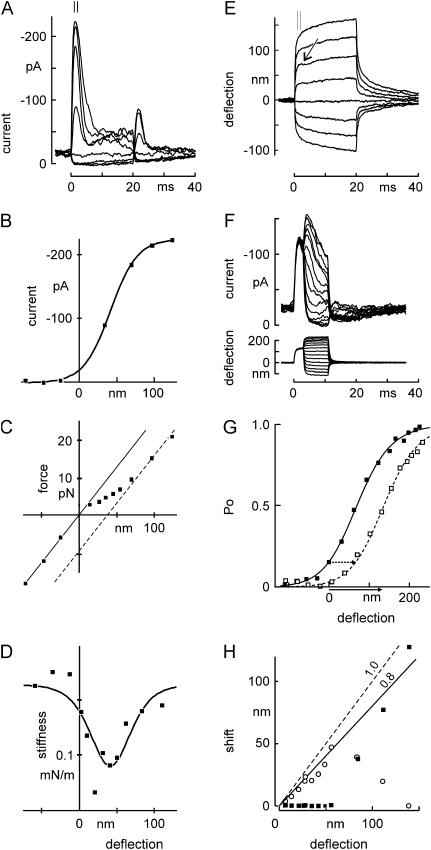
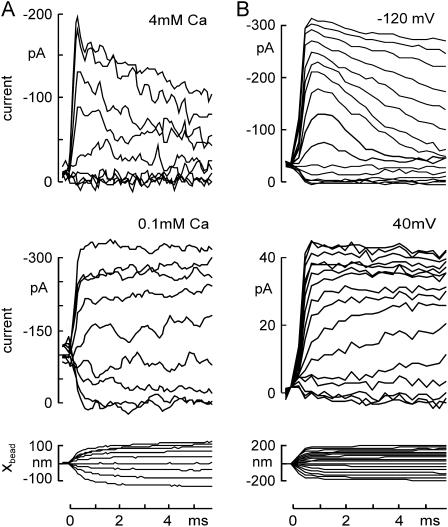
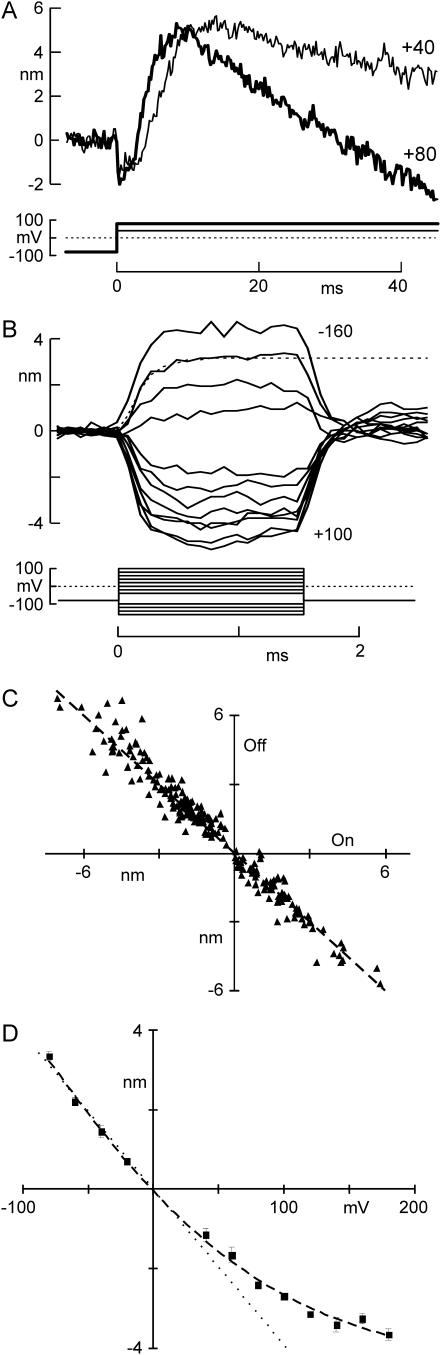
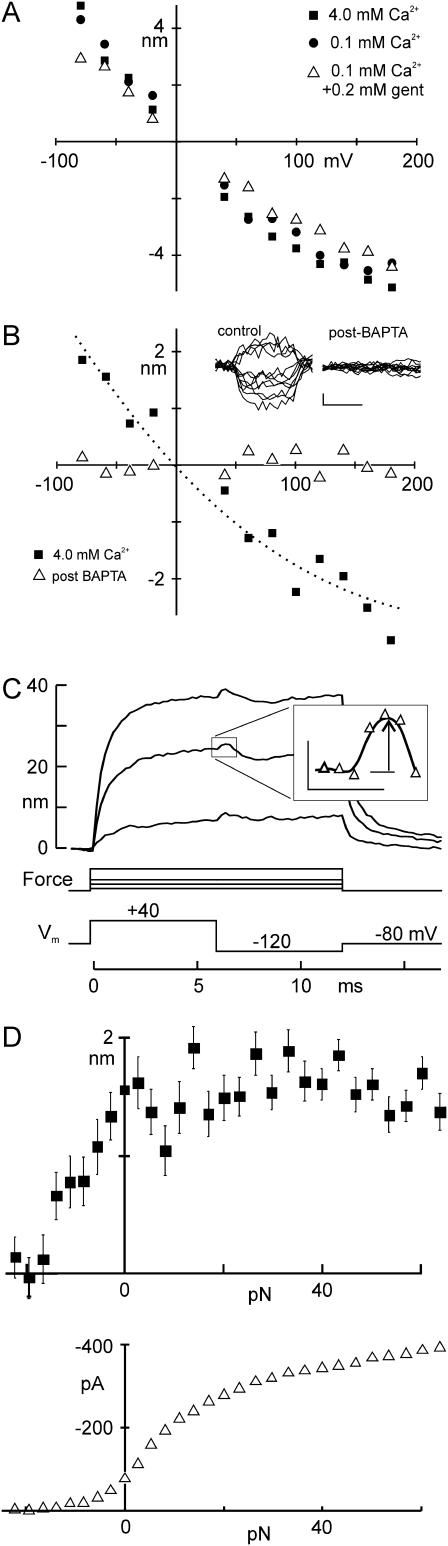
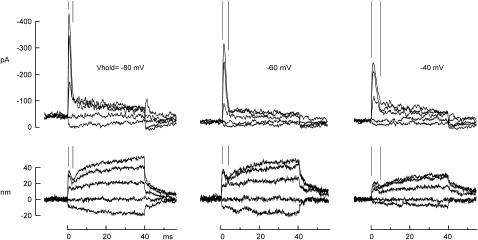
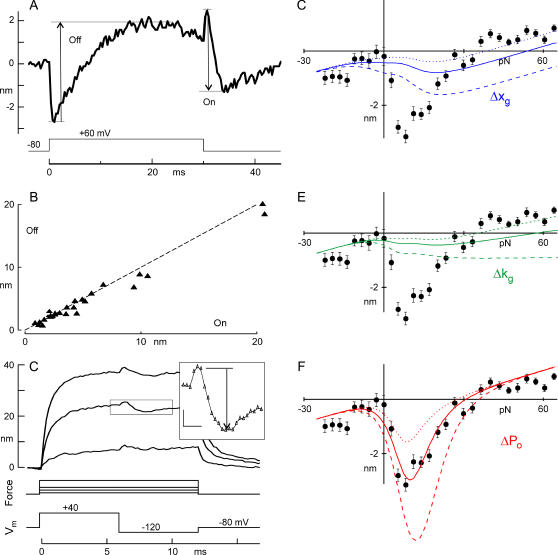
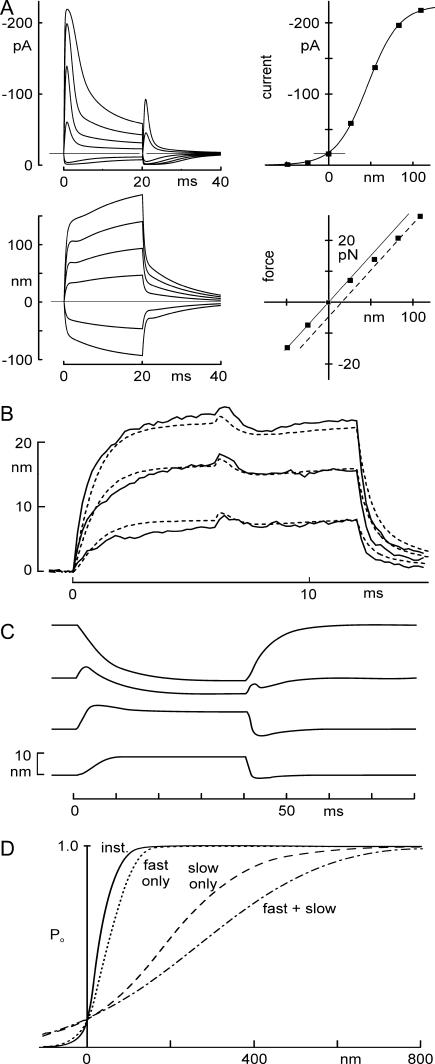
The mechanically gated transduction channels of vertebrate hair cells tend to close in approximately 1 ms after their activation by hair bundle deflection. This fast adaptation is correlated with a quick negative movement of the bundle (a "twitch"), which can exert force and may mediate an active mechanical amplification of sound stimuli in hearing organs. We used an optical trap to deflect bullfrog hair bundles and to measure bundle movement while controlling Ca(2+) entry with a voltage clamp. The twitch elicited by repolarization of the cell varied with force applied to the bundle, going to zero where channels were all open or closed. The force dependence is quantitatively consistent with a model in which a Ca(2+)-bound channel requires approximately 3 pN more force to open, and rules out other models for the site of Ca(2+) action. In addition, we characterized a faster, voltage-dependent "flick", which requires intact tip links but not current through transduction channels.


Figures

FIGURE 1
FIGURE 1
Calculation of bundle movement for three sites of Ca2+ binding. See text for details. (AC) Models in which Ca2+ affects the force dependence of channel open probability (ΔPo), the stiffness of the gating spring (Δkg), or the relaxation of a release element (Δxg). Top: Predicted X(F) relation as measured at the tip of a hair bundle. (Inset) Predicted movement of a bundle upon Ca2+ entry. (Bottom) Predicted Po(F) curve. (Thick lines) Ca2+ sites unbound; (thin lines) Ca2+ sites bound; (colored lines) steady-state and incorporate probability of site occupancy. (D) Schematic of model elements. (E) Predicted bundle movement upon Ca2+ entry for three models, with extreme parameters (Table 1) for channel number and gate swing. (F) Predicted bundle movement upon Ca2+ entry for three models, with parameters as measured for the cell in Fig 7.
FIGURE 2
FIGURE 2
Mechanical and electrical responses to a family of force steps. (A) Receptor current elicited by deflection of a hair bundle with the optical trap. The receptor current showed a rapid activation for positive deflections, followed by a fast (∼5-ms) phase of adaptation. A second phase of slower adaptation was apparent with longer stimuli. Negative deflections also produced adaptation, as shown by a rebound transient current upon termination. Inward current is shown as upwards. (B) Peak receptor current as a function of deflection. The current was averaged from 1.0 to 2.0 ms after deflection (indicated by bars in A). Deflections were measured from E during the same time interval. The smooth curve is a first-order Boltzmann relation with midpoint at 41 nm and steepness of 18 nm. (C) Force versus deflection, with force measured at the peak of the receptor current. Deflections are from E, and forces were calculated from the deviation between bead position and trap center. Note that the figure has axes reversed from Fig. 1, A–C, top, but illustrates the same phenomena. Consistent with the gating-spring model of transduction, the “instantaneous” F(X) relation lies between two lines of the same slope, corresponding to transduction channels all closed (solid line) or all open (dotted line). (D) Instantaneous stiffness of the bundle as a function of bundle deflection. The stiffness (calculated by stepwise differentiating the force with respect to displacement in C) showed the characteristic dip near the center of the I(X) curve due to gating compliance. The curve is the derivative of a fit by eye to the data in C. (E) Bundle movement with two phases. The bundle movement corresponding to A showed a fast (0.2-ms) deflection followed by a slow relaxation for large deflections. For small positive deflections, an additional small and rapid negative movement occurred at the same timescale (2–4 ms) as the fast phase of adaptation (arrow). (F) Stimulus protocol to test the mechanism of fast adaptation. An adapting step of 130 nm was presented for 3 ms and followed by test steps of amplitudes between −112 and + 226 nm. A different cell is depicted from that of AE. (G) I(X) curves measured with (open symbols, data from F) or without (solid symbols, data not shown) a 3-ms adapting step of 130 nm. The solid line is a fit by eye to the resting I(X) curve; the dashed line is the same but shifted to the right by 67 nm. (H) Amplitudes of fast and slow adaptation with increasing deflection, in a third cell. Adaptation was measured as an inferred shift with time (calculated from the receptor current and the measured I(X) relation), and the shift with time was fitted with a double exponential relation. The fast phase of I(X) shift (○) showed near-complete adaptation for small steps but declined for larger steps, whereas the slower phase (▪) was negligible for small steps, and rose to ∼80% for larger steps.
FIGURE 3
FIGURE 3
Changing adaptation rate by influencing Ca2+ influx through transduction channels. (A) Adaptation slowed by reducing external Ca2+ concentration. Transduction currents, evoked by a family of 6-ms force steps and recorded at −80 mV, showed robust adaptation in 4 mM Ca2+ external solution (top), which was slowed by reducing the external Ca2+ concentration to 0.1 mM (middle). The corresponding bundle deflection in 4 mM Ca2+ is shown (bottom). Force steps were from −30 to +65 pN. (B) Adaptation slowed by depolarizing the cell. Holding potential was changed to −120 mV (top) or to +40 mV (middle) 4 ms before the force steps. Adaptation of the transduction current was largely abolished at +40 mV. In addition, channels appeared to open more slowly. The bundle deflection at −120 mV is shown (bottom).
FIGURE 4
FIGURE 4
Hair bundle movement induced by voltage steps. (A) Depolarization-evoked movement of unrestrained hair bundles occurred in three phases: a fast negative phase (“flick”), a subsequent positive phase (“twitch”) and a slow negative phase (slow adaptation). Stepping to +80 mV produced faster movements for the two later phases than stepping to +40mV, but did not affect the time course of the flick. (B) Short voltage steps applied to measure the flick in isolation from slower phases. Hyperpolarizations produced positive movements, whereas depolarizations caused negative movements. The dashed line is an exponential fit with a time constant τ = 165 μs. (C) Equal magnitude of the flick at the onset and offset of the voltage steps (least-squares fit: slope = −1.03, R = 0.978, N = 18 cells). (D) Voltage dependence of flick, shown as change from the holding potential of −80 mV. The flick depended linearly on voltage changes from −80 to +140 mV, but became sublinear for more positive voltages. Dashed line is a Boltzmann fit with dx = 96 mV and x0 = −102 mV.
FIGURE 5
FIGURE 5
Effects of altering transduction on the flick. (A) Effects of external Ca2+ and of gentamicin, a transduction channel blocker. The flick as a function of voltage was not significantly different with 4 mM Ca2+ (▪), with 0.1 mM Ca2+ (•), or with 0.1 mM Ca2+ + 0.2 mM gentamicin (▵) in the external solution. Five other cells showed the same effect. (B) Flick as a function of voltage before (▪) and after (▵) bath application of BAPTA to break tip links (5 mM for 10–20 s, until the receptor current was abolished). Both data sets were recorded with 4 mM Ca2+ in the bath solution. The flick was abolished by BAPTA treatment. Four other cells showed the same effect. (Inset) Example of flick movements before and after BAPTA. Scale represents 1 nm and 1 ms. (C) Flick evoked with varying gating spring tension. A cell was depolarized to +40 mV and one of a family of 29 force steps was simultaneously applied to deflect the bundle. Six milliseconds after the start of each force step, the voltage was stepped back to −120 mV, producing a positive-going flick. To measure the size of the flick, bundle positions were averaged 0–0.2 ms before and 0.2–0.4 ms after the voltage step (inset: scale, 1 ms, 1 nm). (D) Flick as a function of force. The flick due to the −160-mV hyperpolarization in C was constant for positive bundle deflections, but rapidly declined to zero below force steps of −16 pN, or −48 nm of bundle deflection. The corresponding receptor current (bottom), measured 1.2 ms after the deflection, declined to near zero at ∼−10 pN.
FIGURE 6
FIGURE 6
Kinetics of fast adaptation and the twitch. Ca2+ influx was reduced by a change in membrane potential delivered 30 ms before a force step. The time course of fast adaptation (indicated by parallel lines) matched that of the negative-going twitch. Both slowed at more positive potentials by a similar amount. 4 mM Ca2+ external solution.
FIGURE 7
FIGURE 7
Characteristics of the twitch, and predictions from three models for fast adaptation. (A) Twitch evoked by depolarization and repolarization. The twitch was measured as shown in the figure, or, when the repolarization twitch was so fast that it overlapped with the flick, was calculated from bundle positions a few milliseconds before and after the repolarization, adding the flick amplitude measured after depolarization. “Off” and “On” refer to Ca2+ unbinding and binding. (B) Magnitudes of the “on” and “off” twitch induced by voltage changes with no mechanical deflection. (N = 15 cells; dotted line with slope of 1.0). The twitch process appears reversible over tens of milliseconds. (C) Voltage-evoked twitch during bias by force steps. Fig. 5 C is replotted, now showing the magnitude of the twitch after repolarizing from +40 to −120 mV (inset, arrow; scale bar, 1 ms, 1 nm). Movement traces from 3 of the 29 force steps are shown. (D) Magnitude of the twitch for a range of forces, fitted with the Δxg model. The model used parameters derived from fitting the I(X) and F(X) data of this cell, as in Fig. 2 (parameters below), and allowed only changes in Δxg to fit. The solid line is the best fit (Δxg = −0.29 nm); dashed lines are fits with values of Δxg twice or half the best-fit value. Best fit was determined by least-squares error. (E) Magnitude of the twitch, fitted with the Δkg model. The model allowed only changes in Δκg to fit. The solid line is the best fit (Δκg = +35 μN m−1); dashed lines are fits with values of Δκg twice or half the best-fit value. (F) Magnitude of the twitch, fitted with the ΔPo model. The solid line is the best fit (Δfo = 1.5 pN); dashed lines are fits with values of Δfo twice or half the best-fit value. Parameters measured from the I(X) and F(X) curves: N = 25 channels, gating sensitivity z = 379 fN, Kg = 390 μN/m, Ks = 270 μN/m, and the stiffness along the tip-link axis of an individual gating spring κg = 1592 μN/m, gate swing d = 1.7 nm. In six other cells, only the ΔPo model gave a reasonable fit.
FIGURE 8
FIGURE 8
Predictions of receptor current and bundle motion for a model in which Ca2+ changes Po(F). (A) Currents and bundle displacements in response to a family of optical trap displacements predicted using the mechanical model, with parameters from Fig. 2. It included a Ca2+-dependent channel closure due to change in force dependence, a myosin-type slow adaptation modeled as in Shepherd and Corey (19), and a voltage-dependent flick measured from short voltage steps. Four predictions (top left, transduction current I(t); bottom left, bundle movement X(t); top right, peak current-displacement I(X); bottom right, force-displacement F(X)) adequately mimicked the experimentally measured data shown in Fig. 2. (B) Measured motion (solid line) and predicted motion (dashed line) of a bundle during 12-ms-long force steps, with the cell depolarized at 0 ms and repolarized at 6 ms. Data replotted from Fig. 7 C. The model used bundle parameters from the cell of Fig. 7 (listed in Fig. 7 legend). One free parameter—the additional force needed to open a transduction channel when Ca2+ is bound—was determined by fitting the data of Fig 6 C. (C) Modeling of bundle movement evoked by depolarization. The model used to predict responses to force steps at a normal holding potential (Fig. 8 A) could also predict the depolarization-evoked movement and the reversal of its polarity seen with varying force bias. Parameters in Table 1. (D) Time-dependent sensitivity of activation. The instantaneous P(X) curve (solid line) has an activation range of ∼100 nm. If fast adaptation (occurring in 1–2 ms) is included, the P(X) curve (dotted line, calculated as the response to maintained steps of different amplitudes) is ∼1.5-fold less sensitive. With only the slow myosin-dependent process (occurring in 10–30 ms), it is broader (dashed line), and with both processes, it is even broader than with myosin adaptation alone (long dashed line). The sensitivity thus depends on the speed of the stimulus. Parameters used were the averages from six cells.

Similar articles

Cited by

References

    1. Dallos, P., and D. Harris. 1978. Properties of auditory nerve responses in absence of outer hair cells. J. Neurophysiol. 41:365–383. - PubMed
    1. Brown, M. C., A. L. Nuttall, and R. I. Masta. 1983. Intracellular recordings from cochlear inner hair cells: effects of stimulation of the crossed olivocochlear efferents. Science. 222:69–72. - PubMed
    1. Overstreet 3rd, E. H., A. N. Temchin, and M. A. Ruggero. 2002. Basilar membrane vibrations near the round window of the gerbil cochlea. J. Assoc. Res. Otolaryngol. 3:351–361. - PMC - PubMed
    1. Brownell, W. E., C. R. Bader, D. Bertrand, and Y. de Ribaupierre. 1985. Evoked mechanical responses of isolated cochlear outer hair cells. Science. 227:194–196. - PubMed
    1. Dallos, P., and B. N. Evans. 1995. High-frequency motility of outer hair cells and the cochlear amplifier. Science. 267:2006–2009. - PubMed

Publication types