. 2005 Oct 10;171(1):35-45.
doi: 10.1083/jcb.200503066.

Cdc25B cooperates with Cdc25A to induce mitosis but has a unique role in activating cyclin B1-Cdk1 at the centrosome

Affiliations

Cdc25B cooperates with Cdc25A to induce mitosis but has a unique role in activating cyclin B1-Cdk1 at the centrosome

Arne Lindqvist et al. J Cell Biol. .

Abstract

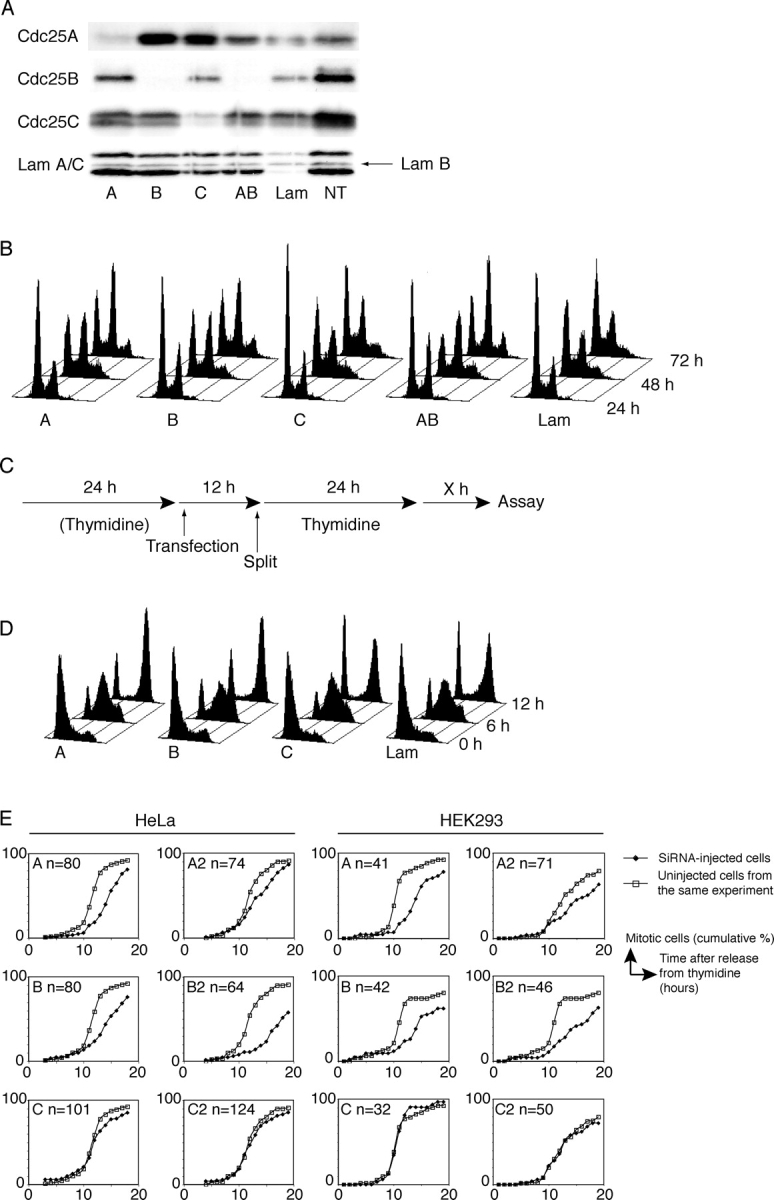
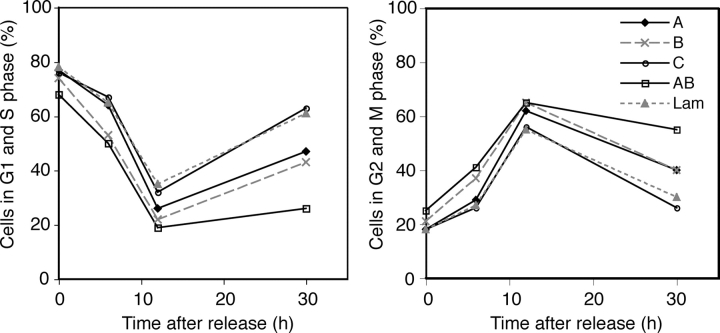
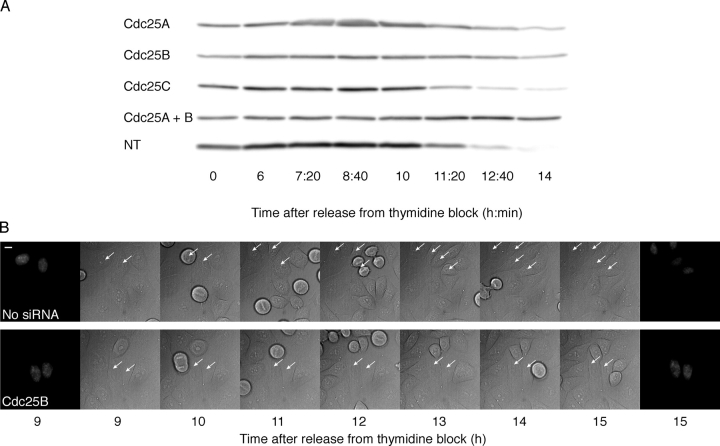
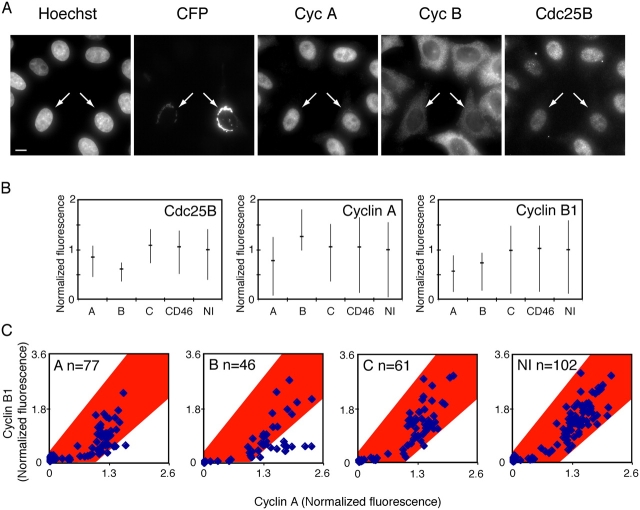
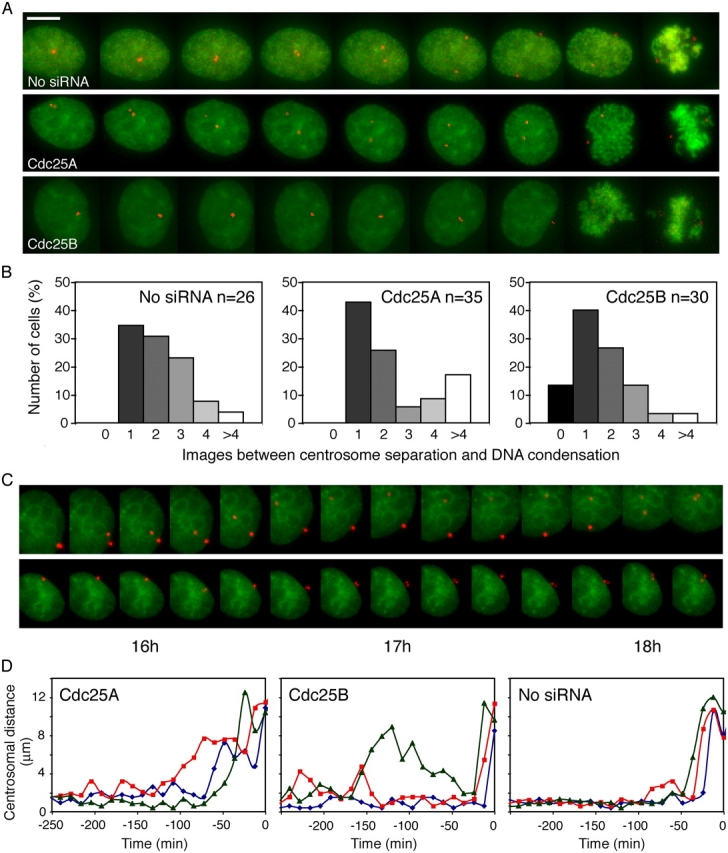
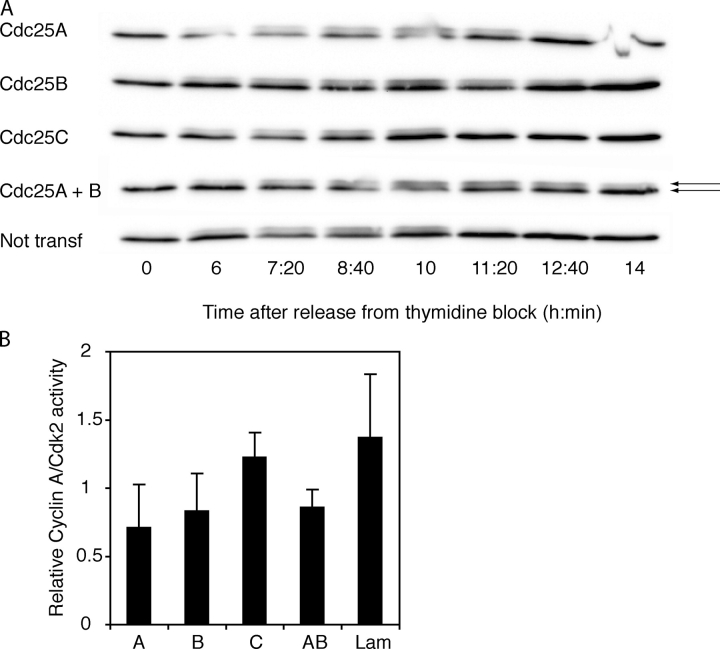
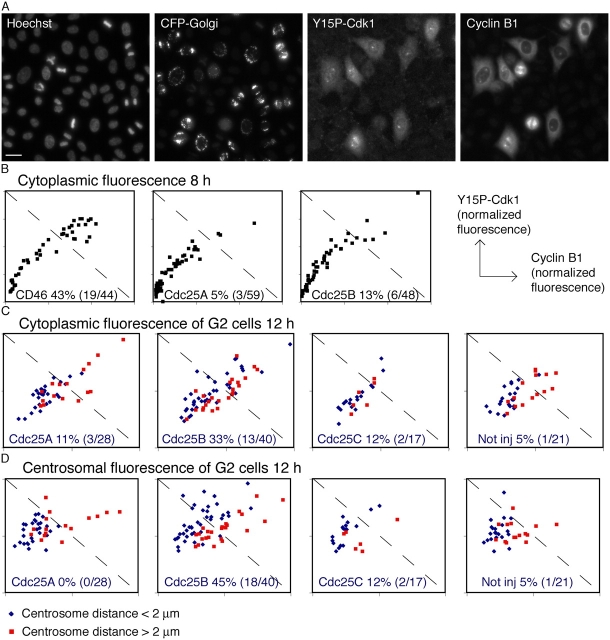
Cdc25 phosphatases are essential for the activation of mitotic cyclin-Cdks, but the precise roles of the three mammalian isoforms (A, B, and C) are unclear. Using RNA interference to reduce the expression of each Cdc25 isoform in HeLa and HEK293 cells, we observed that Cdc25A and -B are both needed for mitotic entry, whereas Cdc25C alone cannot induce mitosis. We found that the G2 delay caused by small interfering RNA to Cdc25A or -B was accompanied by reduced activities of both cyclin B1-Cdk1 and cyclin A-Cdk2 complexes and a delayed accumulation of cyclin B1 protein. Further, three-dimensional time-lapse microscopy and quantification of Cdk1 phosphorylation versus cyclin B1 levels in individual cells revealed that Cdc25A and -B exert specific functions in the initiation of mitosis: Cdc25A may play a role in chromatin condensation, whereas Cdc25B specifically activates cyclin B1-Cdk1 on centrosomes.


Figures

Figure 1.
Figure 1.
Cells with reduced Cdc25A or -B levels are delayed in G2/M progression. (A) Specific siRNA targeting of Cdc25 isoforms. HeLa cells were transfected with siRNA to Cdc25A (A), -B (B), -C (C), -A and -B (AB), or Lamin A/C (Lam) in the first release of a double thymidine block. 9 h after the second release (40 h after transfection), cells were harvested for Western blot. The antibodies used for immunoblotting are indicated to the left of and transfected siRNAs below the figure. The levels of Lamin B (arrow) indicate equal protein loading (not affected by Lamin A/C silencing). NT, not transfected. (B) FACS profiles of unsynchronized cells 24, 48, and 72 h after transfection of siRNA to Cdc25A (A), -B (B), -C (C), -A and -B (AB), or Lamin A/C (Lam). The x axis is logarithmic. (C) Outline of experimental setup used when transfecting siRNA for collection of synchronized cells at different time points. Cells were subjected to either a single or a double thymidine block. (D) FACS profiles of synchronized cells. HeLa cells were transfected with siRNA to Cdc25A (A), -B (B), -C (C), or Lamin A/C (Lam). Samples were taken for FACS analysis at 0, 6, and 12 h after release from a thymidine block. The x axis is linear. (E) Time-lapse microscopy of synchronized cells. SiRNA-injected HeLa or HEK293 cells were followed with time-lapse microscopy after release from a thymidine block. The timing of mitosis of microinjected cells was compared with the timing of mitosis of uninjected cells in the same dish. The siRNA used for injection and the number of monitored cells is indicated in the graphs. Two different sets of siRNA oligos were used (A, B, and C; A2, B2, and C2). For an example of images from time-lapse microscopy, see Fig. 3 B.
Figure 2.
Figure 2.
Combining Cdc25A and -B siRNA leads to a cell cycle block. HeLa cells were transfected with siRNA to Cdc25A (A), -B (B), -C (C), -A and -B (AB), or Lamin A/C (Lam). Samples were harvested for FACS analysis at the indicated time points after release from a thymidine block. The left graph shows the combined fractions of cells in G1 and S phases, and the right graph shows cells in G2 or M phases.
Figure 3.
Figure 3.
The delay caused by siRNA to Cdc25A or -B occurs before prophase. (A) Transfection of siRNA to Cdc25A or -B leads to a delay in cyclin A degradation. HeLa cells were transfected and synchronized, and at the indicated time points, samples were taken for immunoblotting using cyclin A antibodies. The time after release from a double thymidine block is indicated below and siRNAs to the left of the figure. NT, not transfected. (B) Cells microinjected with siRNA to Cdc25A or -B are delayed in G2 with uncondensed DNA. Time-lapse images were acquired as in Fig. 1 E of synchronized, siRNA-injected HeLa cells. Cells on a single glass-bottomed dish were microinjected with or without Cdc25B siRNA together with a pYFP-histone H2B plasmid. The first and last images show YFP-histone H2B fluorescence at the start and at the end of the experiment. The middle images were acquired with differential interference contrast. Bar, 10 μm.
Figure 4.
Figure 4.
Cyclin accumulation is delayed in cells injected with siRNA to Cdc25A or -B. HeLa cells were microinjected with pCFP-Golgi as a marker for injected cells, together with siRNA to Cdc25A, -B, or -C, and fixed 8 h after release from a thymidine block. Cells were stained with antibodies to cyclin A, cyclin B1, and Cdc25B and the fluorescence was quantified as described in Materials and methods. (A) Example of images (maximum intensity projections) of cells injected with siRNA to Cdc25B. Microinjected cells (which express CFP-Golgi) are indicated by arrows. Bar, 10 μm. (B) Average fluorescence levels of Cdc25B (left), cyclin A (middle), and cyclin B1 (right) in siRNA-treated cells. The horizontal lines show the average, whereas the vertical lines visualize the quartiles of the quantified fluorescence. (C) Cyclin A and B1 fluorescence in single cells. Nuclear cyclin A levels (x axis) plotted against cytoplasmic cyclin B1 levels (y axis) for individual cells. In each graph the injected siRNA and number of quantified cells are shown. To facilitate the comparison, the area that includes all uninjected cells is marked in red and transferred to all graphs. As shown, a subset of cells injected with siRNA to Cdc25B express very little cyclin B1 but contain high cyclin A levels. NI, not injected.
Figure 5.
Figure 5.
Decreased time between centrosome separation and DNA condensation in a fraction of cells injected with siRNA to Cdc25B. HeLa cells were microinjected with the marker plasmids pYFP-histone H2B and pdsRED-γ-tubulin alone or together with siRNA to Cdc25A or -B. After release from a thymidine block, injected cells were followed by 3D time-lapse microscopy. (A) Examples of the behavior of cells entering mitosis. Images show maximum intensity projections of YFP-histone H2B and dsRED-γ-tubulin fluorescence. The time between images is 12 min. (top) Normal mitotic progression of a cell injected with pYFP-histone H2B and pdsRED-γ-tubulin. (middle) Delay between centrosome separation and chromosome condensation in cell microinjected with siRNA to Cdc25A. (bottom) Less than 12 min between centrosome separation and chromosome condensation in cell injected with siRNA to Cdc25B. Bar, 10 μm. (B) Time between centrosome separation and DNA condensation in a larger number of siRNA-treated cells. The number of images between centrosome separation and DNA condensation is shown below. The distance between images is 12 min. (C) Centrosomes separate but reunite in a subset of cells injected with siRNA to Cdc25B. Example of two cells microinjected with siRNA to Cdc25B that do not enter mitosis in the time frame of the experiment. The time after release from a thymidine block is indicated below the figure. (D) Quantification of centrosome distances before entry into mitosis. Each graph presents the behavior of three single cells. The distance between centrosomes was measured in 3D and plotted against time. Time 0 is defined as first time point when DNA condensation is clearly visible.
Figure 6.
Figure 6.
Reduced activities of both cyclin A–Cdk2 and cyclin B1–Cdk1 in lysates of cells transfected with siRNA to Cdc25A or -B. (A) Delayed dephosphorylation of Cdk1 in cells treated with siRNA to Cdc25A or -B. SiRNA-transfected synchronized cells were subjected to Cdk1 immunoblotting. Arrows indicate the faster migrating unphosphorylated Cdk1 (bottom band) and the slower migrating phosphorylated Cdk1 (top band). siRNAs are indicated to the left. A quantification of the ratios of inactive versus active Cdk1 is available in Fig. S1 (available at http://www.jcb.org/cgi/content/full/jcb.200503066/DC1). (B) Reduced activation of cyclin A–Cdk2 in cells treated with siRNA to Cdc25A or -B. Cyclin A was immunoprecipitated from siRNA-transfected cells 9 h after release from thymidine block. The ability of the immunoprecipitate to phosphorylate histone H1 as well as the amount of Cdk2 in the immunoprecipitate was assessed. Bars show average from three independent experiments of normalized ratio between cyclin A–Cdk2 activity and amount of Cdk2.
Figure 7.
Figure 7.
Cdc25B dephosphorylates cyclin B1–Cdk1 on the centrosomes. HeLa cells were microinjected with pCFP-Golgi together with siRNA to Cdc25A, -B, -C, or CD46 after release of a double thymidine block and fixed 8 or 12 h after release. Cells were stained with antibodies to phosphorylated Cdk1 (Y15P Cdk1) and to cyclin B1. The specificity of the Cdk1-P antibody is demonstrated in Fig. S2 (available at http://www.jcb.org/cgi/content/full/jcb.200503066/DC1). (A) Examples of cells microinjected with siRNA to Cdc25B and stained with Y15P Cdk1 12 h after release from thymidine block. The Y15P Cdk1 staining is high on centrosomes in G2 cells but low in metaphase cells. Most surrounding cells have passed through mitosis. Bar, 25 μm. (B) Cytoplasmic cyclin B1 (x axis) and Y15P Cdk1 (y axis) fluorescence 8 h after release from a thymidine block. Each dot corresponds to one cell. The diagonal line indicates the levels of cyclin B1 and Y15P at which the control cells are starting to activate Cdk1 (the Y15P Cdk1 accumulation slows down). The fraction of cells above this line is indicated in percent and in numbers of cells in each graph. Cytoplasmic (C) and centrosomal (D) cyclin B1 (x axis) and Y15P Cdk1 (y axis) fluorescence in G2 cells 12 h after release from a thymidine block. Red dots represent cells with separated centrosomes and blue dots cells where centrosomes are not separated. The diagonal line indicates the levels of cyclin B1 and Y15P above which the majority of control cells contain separated centrosomes. The fraction of cells with unseparated centrosomes above this line is indicated in percent and in numbers of cells in each graph. Note that cells situated above the diagonal line in B have not separated their centrosomes and most probably correspond to cells below the diagonal line in C.

References

    1. Bernardi, R., D.A. Liebermann, and B. Hoffman. 2000. Cdc25A stability is controlled by the ubiquitin-proteasome pathway during cell cycle progression and terminal differentiation. Oncogene. 19:2447–2454. - PubMed
    1. Brandeis, M., and T. Hunt. 1996. The proteolysis of mitotic cyclins in mammalian cells persists from the end of mitosis until the onset of S phase. EMBO J. 15:5280–5289. - PMC - PubMed
    1. Bulavin, D.V., Y. Higashimoto, Z.N. Demidenko, S. Meek, P. Graves, C. Phillips, H. Zhao, S.A. Moody, E. Appella, H. Piwnica-Worms, and A.J. Fornace. 2003. Dual phosphorylation controls Cdc25 phosphatases and mitotic entry. Nat. Cell Biol. 5:545–551. - PubMed
    1. Chae, H.D., J. Yun, Y.J. Bang, and D.Y. Shin. 2004. Cdk2-dependent phosphorylation of the NF-Y transcription factor is essential for the expression of the cell cycle-regulatory genes and cell cycle G1/S and G2/M transitions. Oncogene. 23:4084–4088. - PubMed
    1. Chen, M.-S., J. Hurov, L.S. White, T. Woodford-Thomas, and H. Piwnica-Worms. 2001. Absence of apparent phenotype in mice lacking Cdc25C protein phosphatase. Mol. Cell. Biol. 21:3853–3861. - PMC - PubMed

Publication types

MeSH terms