. 2005 Nov 15;102(46):16539-46.
doi: 10.1073/pnas.0507207102. Epub 2005 Oct 10.

Making ATP

Affiliations

Making ATP

Jianhua Xing et al. Proc Natl Acad Sci U S A. .

Abstract

We present a mesoscopic model for ATP synthesis by F(1)F(o) ATPase. The model combines the existing experimental knowledge of the F(1) enzyme into a consistent mathematical model that illuminates how the stages in synthesis are related to the protein structure. For example, the model illuminates how specific interactions between the gamma, epsilon, and alpha(3)beta(3) subunits couple the F(o) motor to events at the catalytic sites. The model also elucidates the origin of ADP inhibition of F(1) in its hydrolysis mode. The methodology we develop for constructing the structure-based model should prove useful in modeling other protein motors.


Figures

Fig. 1.
Fig. 1.
Structure of the F1Fo ATPase. The membrane-spanning Fo motor drives the rotation of the γ/ε-shaft by using the energy of the transmembrane ionmotive force (18). The F1 hexamer contains three catalytic sites alternating with three noncatalytic sites. The shaft is eccentric, so that its rotation sequentially stresses the catalytic sites to release ATP (see text). Details of the structure and Boyer's “binding change” model can be found in refs. and . [Reproduced with permission from ref. (Copyright 2000, Springer/Kluwer Academic, Dordrecht, The Netherlands).]
Fig. 2.
Fig. 2.
Fig. 3.
Fig. 3.
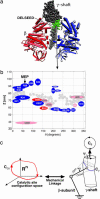
Kinematics coordination between the catalytic site and the rotation of the γ shaft during the synthesis cycle. (a) The track on the γ shaft (colored green) that guides the hinge-bending motion of the β-subunits (43, 44). Two β-subunits are shown in closed (red) and open (blue) conformations. Motion along this track couples the hinge-bending motion of the β-subunit and the γ shaft rotation. (b) The γ shaft unrolled to show residues lining the circumferential track. Contact residues obtained from interpolated structures are marked within the band of the track. Residues that form the boundaries of this track are shown in colors (blue, positively charged; red, negatively charged; pink, polar) (43). Some other important residues are also shown: γR36 is the most eccentric residue, labeled MEP (i.e., furthest from the axis of rotation); γQ255 activates binding of nucleotide successively by interacting with the β-subunit; γR242 activates phosphate release in the hydrolysis direction by interacting with DELSEED; γM23 also interacts with DELSEED via charge-hydrophobic interactions. Residue IDs follow bovine structures (see also Movie 1). (c) The coordinates of the catalytic residues execute a closed loop in their n-dimensional configuration space, Rn, during one synthesis cycle. The mechanical linkage between the catalytic site and the DELSEED motif at the C terminus of the β-subunit couples the motion of the catalytic site to the β tip via its hinge-bending motion. The β tip pushes on the eccentric γ shaft driving its rotation. As the γ shaft rotates, the β-subunit hinges between its open and closed positions. The contact between the β and γ shaft is confined to the strip defined in b; the location of the tip on the γ shaft surface can be located by the bending angle, φ, and the azimuthal angle, ψ. We will assume that the β bending and the γ rotation is tightly coupled, so that the β tip traces out a closed curve, Cγ, on the surface of the γ-subunit that is confined within the track. Because points along the track Cγ can be mapped onto the rotational angle, θ, the mechanical linkage defines the kinematic relationship between the configurational cycle at the catalytic site and the rotational position of the γ shaft. This mapping allows us to parametrize the potentials of mean force describing the conformational changes in the catalytic site by the rotation coordinate, θ, of the γ shaft.
Fig. 4.
Fig. 4.
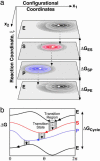
Schematic representation of a set of potential surfaces for the generic reaction cycle: E (Empty) ↔ S (Substrate) ↔ P (Product) ↔ E. (a) The potential of mean force for the E state as a function of the catalytic site conformation (here shown schematically with two degrees of freedom, x1 and x2). As the substrate binds, a chemical transition drops the state through a free energy ΔGES to the S state. A further configurational energy drop takes place along the S potential surface until the reaction region for the E → P transition is reached, whereupon the system drops to the P surface, and so on, until the E surface is reached once again, completing the cycle, with a total free energy drop of ΔGCycle. (b) The diagram can be simplified by showing only the free energy cross-sections along the cycle parametrized by θ. The shaded regions are the saddle-shaped free energy reaction paths where chemical transitions are allowed.
Fig. 5.
Fig. 5.
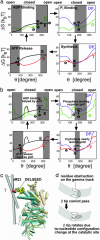
Step-by-step construction of the potentials in the synthesis direction for one β-subunit along the rotational coordinate, θ.(a) Basic potentials due to interactions within a catalytic site. The shaded regions are the chemical transition windows. (b) Potentials modified by interactions between α3β3 and γ/ε; the dashed lines show where the potentials in a have been modified. The motor is subjected to a constant 45/3pN·nm torque from the Fo motor, so the total torque acting on the three β-subunits is 45 pN·nm. During one rotation cycle, the catalytic site executes a conformational cycle: open → closed → open. In b, we have labeled features revealed by the model, such as pmf dependence, that are consistent with experimental observations. The substrate concentrations used in this figure are [ATP] = 1 mM, [ADP] = 0.1 mM, [Pi] = 1 mM. The numbers follow a typical cycle in the ATP synthesis direction (the ε subunit is presumably in the “up” conformation). 1 → 2 → 3, an open empty site closes sufficiently to bind an ADP molecule; 3 → 4 → 5, binding phosphate requires F1 being driven upward along the D curve by the torque from Fo (i.e., ion motive force is necessary for phosphate binding); 5 → 6 → 7, ATP is synthesized; 7 → 8, hydrogen-bond network is peeled off by the torque from Fo; 8 → 9, ATP molecule is released; 9 → 1, cycle repeats. (c) Here we use interactions between γM23 and the DELSEED motif of a β-subunit to illustrate origins of the potential bumps introduced in b. With ADP bound in the catalytic site (the β-subunit shown in cyan), the DELSEED motif (shown in yellow) hits γM23 (shown in red), which produces the potential bump introduced on the D curve near 330°. Releasing ADP results in conformational changes of the β-subunit (shown in transparent orange) in directions orthogonal to the rotation direction, so DELSEED no longer interacts strongly with γM23. (d) Cartoon illustrating the effect of the modified potentials.
Fig. 6.
Fig. 6.
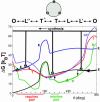
The overall potentials of wild-type E. coli.F1 ATPase, as a function of the rotational angle θ with the three catalytic sites tightly coupled by the rotary γε shaft. As the γ shaft rotates, the three catalytic sites move together with a fixed phase difference (heavy lines), resulting in multisite coupling. A typical pathway is shown by the heavy line. The free energy profiles shown correspond to substrate concentrations [ATP] = 1 mM, [ADP] = 0.1 mM, [Pi] = 1 mM. Also shown above the figure is the approximate correspondence between the catalytic site conformational states discussed by Menz et al. (using their labels) (35) and the continuum representation used here. Also shown are the regions where the torque from the γ shaft (i.e., the pmf) is strictly required to advance the cycle. The most probable angular regions for chemical transitions vary with substrate concentration. In a purely chemical kinetic model, the “dominant” reaction pathways would change with substrate concentrations. An animation of this figure showing the synthesis cycle is available as Movie 2.
Fig. 7.
Fig. 7.
Fitting the data with the model. The calculated (solid lines) and experimentally measured steady state ATP synthesis rates (circles) as a function of ADP concentration (with fixed Pi concentrations as labeled) (a) and phosphate concentration (with fixed ADP concentrations as labeled) (b) (data are from ref. 52). Also shown are multiple reaction pathways calculated with the model. (c) Physiological conditions: [ATP] = 1 mM, [ADP] = 0.1 mM, and [Pi] = 1 mM. (d) Experimental condition: [ATP] = 1 μM, [ADP] = 1.3 mM, and [Pi] = 3.2 mM. To calculate the flux diagram 120° of the the rotational coordinate θ is divided into four equal regions. Fluxes among the 64 × 4 chemical–mechanical states are calculated; those shown in the figures contribute >95% of the overall flux (defined as the total flux summed over the 64 chemical states at a given angular position). Because of the threefold rotational symmetry of the system, when rotating out of 0°, a state labeled as (s1, s2, s3) becomes (s2,s3,s1) entering from at 120°. Note that even though a state makes a large contribution to the flux, this does not necessarily mean that the state has a high probability of being observed.

Similar articles

Cited by

References

    1. Boyer, P. (1997) Annu. Rev. Biochem. 66, 717–749. - PubMed
    1. Kinosita, K., Adachi, K. & Itoh, H. (2004) Annu. Rev. Biophys. Biomol. Struct. 33, 245–268. - PubMed
    1. Nakamoto, R., Ketchum, C., Kuo, P., Peskova, Y. & Al-Shawi, M. (2000) Biochim. Biophys. Acta 1458, 289–299. - PubMed
    1. Weber, J. & Senior, A. E. (2003) FEBS Lett. 545, 61–70. - PubMed
    1. Weber, J. & Senior, A. (2000) Biochim. Biophys. Acta 1458, 300–309. - PubMed

Publication types

MeSH terms

Substances