Regional vegetation die-off in response to global-change-type drought
- PMID: 16217022
- PMCID: PMC1250231
- DOI: 10.1073/pnas.0505734102
Regional vegetation die-off in response to global-change-type drought
Abstract
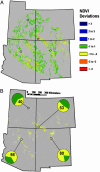
Future drought is projected to occur under warmer temperature conditions as climate change progresses, referred to here as global-change-type drought, yet quantitative assessments of the triggers and potential extent of drought-induced vegetation die-off remain pivotal uncertainties in assessing climate-change impacts. Of particular concern is regional-scale mortality of overstory trees, which rapidly alters ecosystem type, associated ecosystem properties, and land surface conditions for decades. Here, we quantify regional-scale vegetation die-off across southwestern North American woodlands in 2002-2003 in response to drought and associated bark beetle infestations. At an intensively studied site within the region, we quantified that after 15 months of depleted soil water content, >90% of the dominant, overstory tree species (Pinus edulis, a piñon) died. The die-off was reflected in changes in a remotely sensed index of vegetation greenness (Normalized Difference Vegetation Index), not only at the intensively studied site but also across the region, extending over 12,000 km2 or more; aerial and field surveys confirmed the general extent of the die-off. Notably, the recent drought was warmer than the previous subcontinental drought of the 1950s. The limited, available observations suggest that die-off from the recent drought was more extensive than that from the previous drought, extending into wetter sites within the tree species' distribution. Our results quantify a trigger leading to rapid, drought-induced die-off of overstory woody plants at subcontinental scale and highlight the potential for such die-off to be more severe and extensive for future global-change-type drought under warmer conditions.
Figures


References
-
- Intergovernmental Panel on Climate Change (2001) Climate Change 2001: Synthesis Report, A Contribution of Working Groups I, II, and III to the Third Assessment Report of the Intergovernmental Panel on Climate Change, eds. Watson, R. T. & Core Writing Team (Cambridge Univ. Press, New York).
-
- Easterling, D. R., Meehl, G. A., Parmesan, C., Changnon, S. A., Karl, T. R. & Mearns, L. O. (2000) Science 289, 2068-2074. - PubMed
-
- Hoerling, M. & Kumar, A. (2004) Science 299, 691-694. - PubMed
Publication types
MeSH terms
Grants and funding
LinkOut - more resources
Full Text Sources
Medical

