. 2005 Oct 18;102(42):15241-6.
doi: 10.1073/pnas.0408851102. Epub 2005 Oct 10.

Low mobility of phosphatidylinositol 4,5-bisphosphate underlies receptor specificity of Gq-mediated ion channel regulation in atrial myocytes

Affiliations

Low mobility of phosphatidylinositol 4,5-bisphosphate underlies receptor specificity of Gq-mediated ion channel regulation in atrial myocytes

Hana Cho et al. Proc Natl Acad Sci U S A. .

Abstract

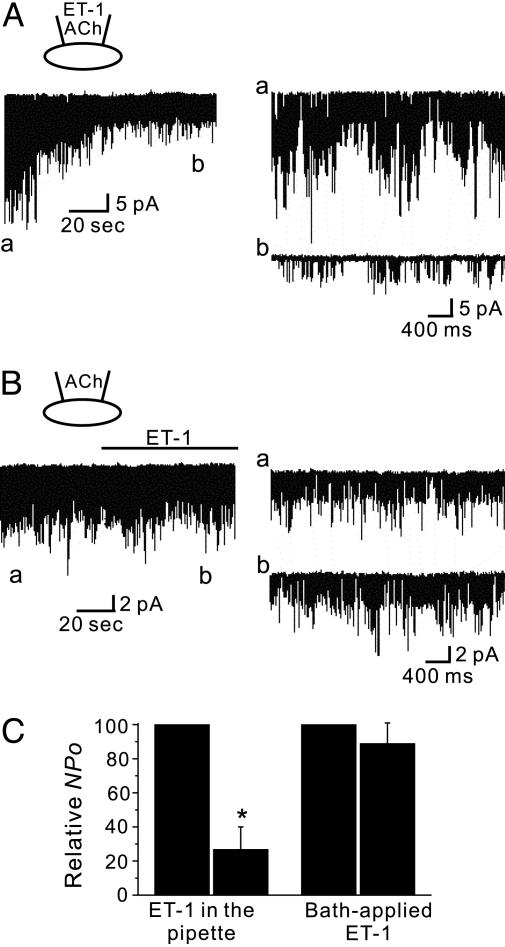
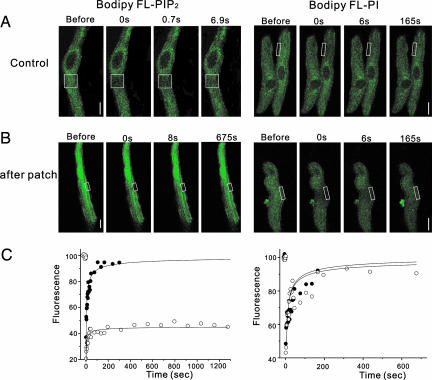
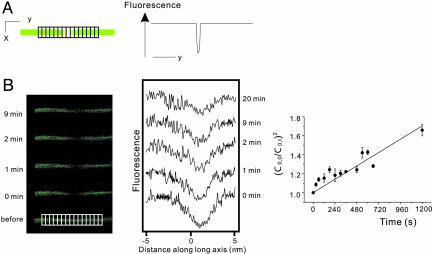
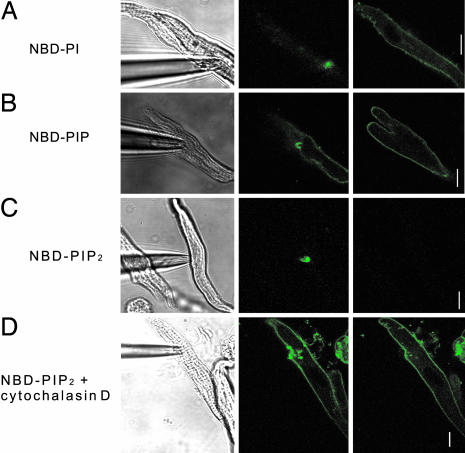
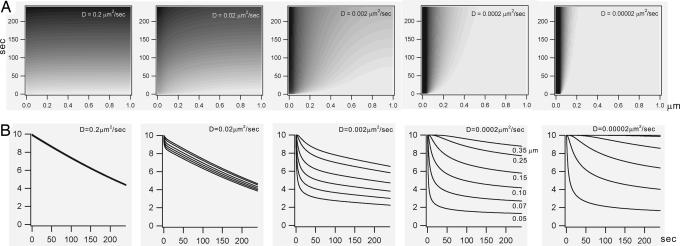
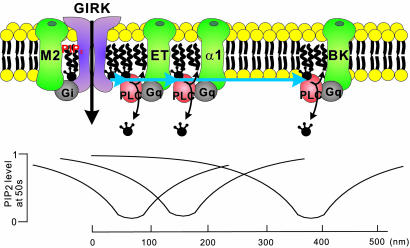
We have shown previously that cardiac G protein-gated inwardly rectifying K+ (GIRK) channels are inhibited by Gq protein-coupled receptors (GqPCRs) via phosphatidylinositol 4,5-bisphosphate (PIP2) depletion in a receptor-specific manner. To investigate the mechanism of receptor specificity, we examined whether the activation of GqPCRs induces localized PIP2 depletion. When we applied endothelin-1 to the bath, GIRK channel activities recorded in cell-attached patches were not changed, implying that PIP2 signal is not diffusible but is a localized signal. To test this possibility, we directly measured lateral diffusion by introducing fluorescence-labeled phosphoinositides to a small area of the membrane with patch pipettes. After pipettes were attached, phosphatidylinositol 4-monophosphate or phosphatidylinositol diffused rapidly to the entire membrane, whereas PIP2 was confined to the membrane patch inside the pipette. The confinement of PIP2 was disrupted after cytochalasin D treatment, suggesting that the cytoskeleton is responsible for the low mobility of PIP2. The diffusion coefficient (D) of PIP2 in the plasma membrane measured with the fluorescence recovery after photobleaching technique was 0.00039 microm2/s (n = 6), which is markedly lower than D of phosphatidylinositol (5.8 microm2/s, n = 5). Simulation of PIP2 concentration profiles by the diffusion model confirms that when D is small, the kinetics of PIP2 depletion at different distances from phospholipase C becomes similar to the characteristic kinetics of GIRK inhibition by different agonists. These results imply that PIP2 depletion is localized adjacent to GqPCRs because of its low mobility, and that spatial proximity of GqPCR and the target protein underlies the receptor specificity of PIP2-mediated signaling.


Figures

Fig. 1.
Fig. 1.
Effects of ET-1 applied with a patch pipette or into the bath. IGIRK was activated by the pipette application of ACh at a holding potential of -80 mV. (A) The application of ET-1 by patch pipette markedly decreased GIRK channel activity. (a and b) Single-channel currents on an expanded time scale are shown. (B) Bath application of ET-1 outside the patch pipette did not inhibit GIRK channels. ET-1 was applied to the bath for the indicated period. (C) Changes in open probability (NPo) after ET-1 was applied by the patch pipette (Left) or into the bath (Right). Values are means ± SEM for five cells. *, P < 0.01 vs. control.
Fig. 2.
Fig. 2.
FRAP revealed low PIP2 mobility. (A) Myocytes were loaded with BODIPY FL-PIP2 (Left) or BODIPY FL-PI (Right). Selected fluorescence images from typical sequences were recorded immediately after bleaching and at various times thereafter. Square boxes indicate the bleached areas. (Scale bars: 5 μm, Left;10 μm, Right.) (B) The same sequential images as shown in A after patch break-in. (Scale bars: 8 μm, Left; 10 μm, Right.) (C) Fluorescence intensities of BODIPY FL-PIP2 (Left) and BODIPY FL-PI (Right) in recovery after bleaching are plotted versus time. A least-squares fit of Eq. 1 (see Materials and Methods) to experimental data is indicated by the line. The curves display kinetics allowing the determination of a single D (see Materials and Methods). FRAP series before (•) and after (○) patch break-in are indicated.
Fig. 3.
Fig. 3.
Calculation of D for PIP2 from the time dependence of the maximum bleach depth. (A)(Left) The fluorescence from a cell is imaged in the x-y plane. The image shows a photobleached area across the cell membrane in the X direction. (Right) The image is integrated across the full width of the cell membrane in the X direction to give a 1D bleaching profile (fluorescence versus position on the long axis of the cell membrane). (B)(Left) Selected fluorescence images of single longitudinal band from the FRAP series shown in Fig. 2B Left. (Center) 1D bleaching profiles derived from the sequences of fluorescence images shown in Left.(Right) A plot of (C(y=0,t=0)/C(y=0,t)) against time in the measurement series shown in Left and Center should give a straight line with gradient formula image, where R0 is the initial half-width (1/e)2 of the bleach.
Fig. 4.
Fig. 4.
Loading of fluorescent phosphoinositides via a patch pipette. Myocytes were attached to a patch pipette containing NBD-labeled PI (A), PIP (B), or PIP2 (C and D). The images in A, B, and D were taken <5 min after attachment, whereas images in C were taken after 15 min. All images were taken under identical conditions (100% power, 2% transmission). (Left) Electrode attachment to myocytes. (Center and Right) The fluorescent images taken at plane where meniscus or whole-cell image is most well visualized, respectively. (D) Cytochalasin D (10 μM) was pretreated for 3 h before pipette attachment. (Scale bars: 10 μm.)
Fig. 5.
Fig. 5.
Effect of distance from the PLC domain on PIP2 depletion profiles. (A) Simulation results for temporal and spatial changes in [PIP2] during PLC activation (abscissa: distance from PLC in μm; ordinate: time in s). Concentration of PIP2 is represented by a gray scale. Parameters for numerical integration: Vmax of PLC = 20 μM/s; Km of PLC = 50% of initial [PIP2]; rmax = 1 μm; Δr = 10 nm; Δt = 0.2 ms; DPIP2 = ≈0.2–0.00002 μm2/s, as indicated. (B) Changes in PIP2 concentrations over time were calculated at 0.05, 0.07, 0.1, 0.15, 0.25, and 0.35 μm from the center of the PLC domain when the D value was given ≈0.2–0.00002 μm2/s, as indicated. Note that spatial differences in depletion kinetics increased as D decreased.
Fig. 6.
Fig. 6.
Model for the spatio-temporal coding of PIP2 signaling in cardiac myocytes. Activation of ET, α1 adrenergic, or BK receptors stimulated PLCβ, which caused PIP2 depletion. Complexes of ET receptors with GIRKs create high local change in [PIP2] in close proximity to GIRKs. Although BK receptors activate PLCβ and consequently deplete PIP2, they fail to inhibit GIRKs because they are physically excluded and remote from GIRK domains. Inhibition of GIRKs by remote GqPCRs is prevented by the low mobility of PIP2. Local changes in [PIP2] caused by the stimulation of ET, α1 adrenergic, or BK receptors were simulated by using the method described in Fig. 5 and [PIP2]at 50 s were plotted. The zero point on the abscissa represents the GIRK channel.

References

    1. Hilgemann, D. W., Feng, S. & Nasuhoglu, C. (2001) Science STKE 111, RE19. - PubMed
    1. McLaughlin, S., Wang, J., Gambhir, A. & Murray, D. (2002) Annu. Rev. Biophys. Biomol. Struct. 31, 151-175. - PubMed
    1. Augustine, G. J., Santamaria, F. & Tanaka, K. (2003) Neuron 40, 331-346. - PubMed
    1. Nasuhoglu, C., Feng, S., Mao, Y., Shammat, I., Yamamato, M., Earnest, S., Lemmon, M. & Hilgemann, D. W. (2002) Am. J. Physiol. 283, C223-C234. - PubMed
    1. Irvine, R. (2004) Curr. Biol. 14, R308-R310. - PubMed

Publication types

MeSH terms