Stretching DNA using the electric field in a synthetic nanopore
- PMID: 16218703
- PMCID: PMC2441849
- DOI: 10.1021/nl0510816
Stretching DNA using the electric field in a synthetic nanopore
Abstract
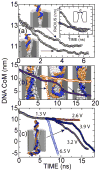
The mechanical properties of DNA over segments comparable to the size of a protein-binding site (3-10 nm) are examined using an electric-field-induced translocation of single molecules through a nanometer diameter pore. DNA, immersed in an electrolyte, is forced through synthetic pores ranging from 0.5 to 1.5 nm in radius in a 10 nm thick Si(3)N(4) membrane using an electric field. To account for the stretching and bending, we use molecular dynamics to simulate the translocation. We have found a threshold for translocation that depends on both the dimensions of the pore and the applied transmembrane bias. The voltage threshold coincides with the stretching transition that occurs in double-stranded DNA near 60 pN.
Figures


Similar articles
-
The electromechanics of DNA in a synthetic nanopore.Biophys J. 2006 Feb 1;90(3):1098-106. doi: 10.1529/biophysj.105.070672. Epub 2005 Nov 11. Biophys J. 2006. PMID: 16284270 Free PMC article.
-
Microscopic Kinetics of DNA Translocation through synthetic nanopores.Biophys J. 2004 Sep;87(3):2086-97. doi: 10.1529/biophysj.104.042960. Biophys J. 2004. PMID: 15345583 Free PMC article.
-
Slowing the translocation of double-stranded DNA using a nanopore smaller than the double helix.Nanotechnology. 2010 Oct 1;21(39):395501. doi: 10.1088/0957-4484/21/39/395501. Epub 2010 Sep 1. Nanotechnology. 2010. PMID: 20808032 Free PMC article.
-
Sizing DNA using a nanometer-diameter pore.Biophys J. 2004 Oct;87(4):2905-11. doi: 10.1529/biophysj.104.041814. Epub 2004 Aug 23. Biophys J. 2004. PMID: 15326034 Free PMC article.
-
Nanopore sequencing technology: nanopore preparations.Trends Biotechnol. 2007 Apr;25(4):174-81. doi: 10.1016/j.tibtech.2007.02.008. Epub 2007 Feb 22. Trends Biotechnol. 2007. PMID: 17320228 Review.
Cited by
-
Stretching and unzipping nucleic acid hairpins using a synthetic nanopore.Nucleic Acids Res. 2008 Mar;36(5):1532-41. doi: 10.1093/nar/gkm1017. Epub 2008 Jan 21. Nucleic Acids Res. 2008. PMID: 18208842 Free PMC article.
-
The role of molecular modeling in bionanotechnology.Phys Biol. 2006 Feb 2;3(1):S40-53. doi: 10.1088/1478-3975/3/1/S05. Phys Biol. 2006. PMID: 16582464 Free PMC article. Review.
-
Mechanism of how salt-gradient-induced charges affect the translocation of DNA molecules through a nanopore.Biophys J. 2013 Aug 6;105(3):776-82. doi: 10.1016/j.bpj.2013.05.065. Biophys J. 2013. PMID: 23931325 Free PMC article.
-
Water-silica force field for simulating nanodevices.J Phys Chem B. 2006 Nov 2;110(43):21497-508. doi: 10.1021/jp063896o. J Phys Chem B. 2006. PMID: 17064100 Free PMC article.
-
Structural analysis of the Sulfolobus solfataricus MCM protein N-terminal domain.Nucleic Acids Res. 2008 Jun;36(10):3235-43. doi: 10.1093/nar/gkn183. Epub 2008 Apr 16. Nucleic Acids Res. 2008. PMID: 18417534 Free PMC article.
References
Publication types
MeSH terms
Substances
Grants and funding
LinkOut - more resources
Full Text Sources
Other Literature Sources

