Improvement of tactile discrimination performance and enlargement of cortical somatosensory maps after 5 Hz rTMS
- PMID: 16218766
- PMCID: PMC1255742
- DOI: 10.1371/journal.pbio.0030362
Improvement of tactile discrimination performance and enlargement of cortical somatosensory maps after 5 Hz rTMS
Abstract
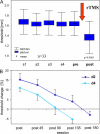
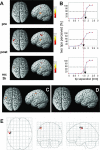
Repetitive transcranial magnetic stimulation (rTMS) is increasingly used to investigate mechanisms of brain functions and plasticity, but also as a promising new therapeutic tool. The effects of rTMS depend on the intensity and frequency of stimulation and consist of changes of cortical excitability, which often persists several minutes after termination of rTMS. While these findings imply that cortical processing can be altered by applying current pulses from outside the brain, little is known about how rTMS persistently affects learning and perception. Here we demonstrate in humans, through a combination of psychophysical assessment of two-point discrimination thresholds and functional magnetic resonance imaging (fMRI), that brief periods of 5 Hz rTMS evoke lasting perceptual and cortical changes. rTMS was applied over the cortical representation of the right index finger of primary somatosensory cortex, resulting in a lowering of discrimination thresholds of the right index finger. fMRI revealed an enlargement of the right index finger representation in primary somatosensory cortex that was linearly correlated with the individual rTMS-induced perceptual improvement indicative of a close link between cortical and perceptual changes. The results demonstrate that repetitive, unattended stimulation from outside the brain, combined with a lack of behavioral information, are effective in driving persistent improvement of the perception of touch. The underlying properties and processes that allow cortical networks, after being modified through TMS pulses, to reach new organized stable states that mediate better performance remain to be clarified.
Figures


Similar articles
-
Sustained increase of somatosensory cortex excitability by tactile coactivation studied by paired median nerve stimulation in humans correlates with perceptual gain.J Physiol. 2007 Oct 15;584(Pt 2):463-71. doi: 10.1113/jphysiol.2007.140079. Epub 2007 Aug 16. J Physiol. 2007. PMID: 17702814 Free PMC article.
-
Improvement of tactile perception and enhancement of cortical excitability through intermittent theta burst rTMS over human primary somatosensory cortex.Exp Brain Res. 2008 Jan;184(1):1-11. doi: 10.1007/s00221-007-1073-2. Epub 2007 Aug 7. Exp Brain Res. 2008. PMID: 17680239
-
Combination of 5 Hz repetitive transcranial magnetic stimulation (rTMS) and tactile coactivation boosts tactile discrimination in humans.Neurosci Lett. 2003 Sep 11;348(2):105-8. doi: 10.1016/s0304-3940(03)00745-6. Neurosci Lett. 2003. PMID: 12902029
-
Modulation of cortical excitability induced by repetitive transcranial magnetic stimulation: influence of timing and geometrical parameters and underlying mechanisms.Prog Neurobiol. 2011 Jan;93(1):59-98. doi: 10.1016/j.pneurobio.2010.10.003. Epub 2010 Nov 5. Prog Neurobiol. 2011. PMID: 21056619 Review.
-
Transcranial magnetic stimulation: new insights into representational cortical plasticity.Exp Brain Res. 2003 Jan;148(1):1-16. doi: 10.1007/s00221-002-1234-2. Epub 2002 Nov 5. Exp Brain Res. 2003. PMID: 12478392 Review.
Cited by
-
State-dependencies of learning across brain scales.Front Comput Neurosci. 2015 Feb 26;9:1. doi: 10.3389/fncom.2015.00001. eCollection 2015. Front Comput Neurosci. 2015. PMID: 25767445 Free PMC article. Review.
-
Improved acuity and dexterity but unchanged touch and pain thresholds following repetitive sensory stimulation of the fingers.Neural Plast. 2012;2012:974504. doi: 10.1155/2012/974504. Epub 2012 Jan 18. Neural Plast. 2012. PMID: 22315693 Free PMC article.
-
TMS-induced cortical potentiation during wakefulness locally increases slow wave activity during sleep.PLoS One. 2007 Mar 7;2(3):e276. doi: 10.1371/journal.pone.0000276. PLoS One. 2007. PMID: 17342210 Free PMC article.
-
Sustained increase of somatosensory cortex excitability by tactile coactivation studied by paired median nerve stimulation in humans correlates with perceptual gain.J Physiol. 2007 Oct 15;584(Pt 2):463-71. doi: 10.1113/jphysiol.2007.140079. Epub 2007 Aug 16. J Physiol. 2007. PMID: 17702814 Free PMC article.
-
Human finger somatotopy in areas 3b, 1, and 2: a 7T fMRI study using a natural stimulus.Hum Brain Mapp. 2014 Jan;35(1):213-26. doi: 10.1002/hbm.22172. Epub 2012 Sep 11. Hum Brain Mapp. 2014. PMID: 22965769 Free PMC article.
References
-
- Grafman J, Wassermann E. Transcranial magnetic stimulation can measure and modulate learning and memory. Neuropsychologia. 1999;37:159–167. - PubMed
-
- Pascual-Leone A, Walsh V, Rothwell J. Transcranial magnetic stimulation in cognitive neuroscience—Virtual lesion, chronometry, and functional connectivity. Curr Opin Neurobiol. 2000;10:232–237. - PubMed
-
- Siebner HR, Rothwell J. Transcranial magnetic stimulation: New insights into representational cortical plasticity. Exp Brain Res. 2003;148:1–16. - PubMed
-
- Klein E, Kreinin I, Chistyakov A, Koren D, Mecz L, et al. Therapeutic efficacy of right prefrontal slow repetitive transcranial magnetic stimulation in major depression: A double-blind controlled study. Arch Gen Psychiatry. 1999;56:315–320. - PubMed
Publication types
MeSH terms
Substances
Grants and funding
LinkOut - more resources
Full Text Sources
Medical

