. 2005 Oct 18;102(42):15110-5.
doi: 10.1073/pnas.0504407102. Epub 2005 Oct 11.

Single-particle tracking of murine polyoma virus-like particles on live cells and artificial membranes

Affiliations

Single-particle tracking of murine polyoma virus-like particles on live cells and artificial membranes

Helge Ewers et al. Proc Natl Acad Sci U S A. .

Abstract

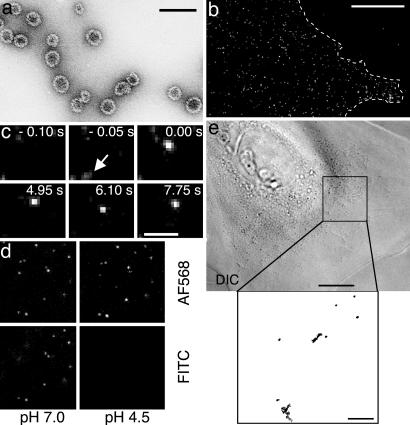
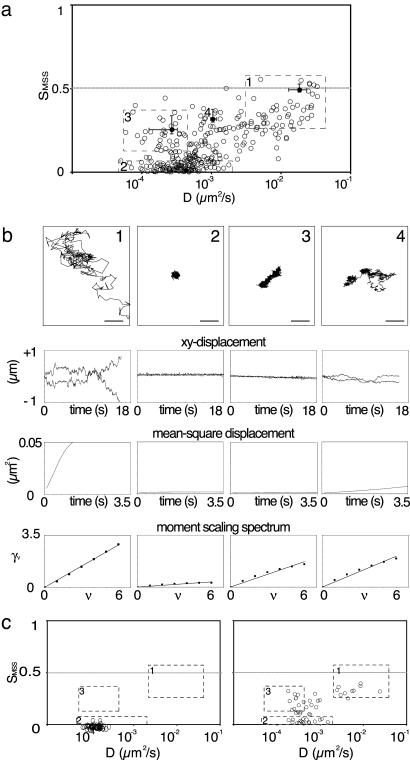
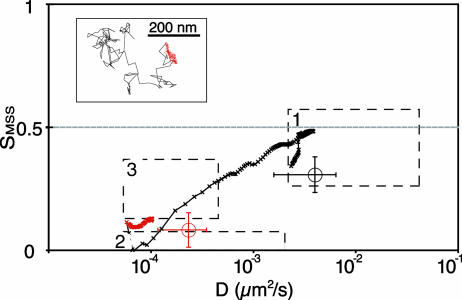
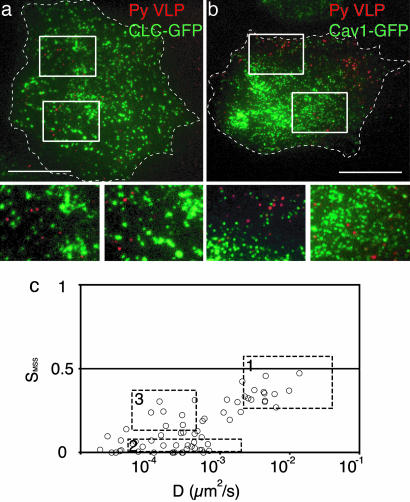
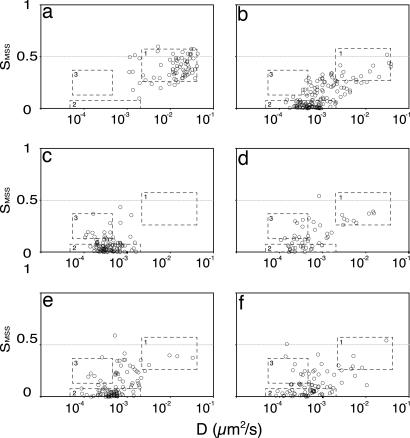
The lateral mobility of individual murine polyoma virus-like particles (VLPs) bound to live cells and artificial lipid bilayers was studied by single fluorescent particle tracking using total internal reflection fluorescence microscopy. The particle trajectories were analyzed in terms of diffusion rates and modes of motion as described by the moment scaling spectrum. Although VLPs bound to their ganglioside receptor in lipid bilayers exhibited only free diffusion, analysis of trajectories on live 3T6 mouse fibroblasts revealed three distinct modes of mobility: rapid random motion, confined movement in small zones (30-60 nm in diameter), and confined movement in zones with a slow drift. After binding to the cell surface, particles typically underwent free diffusion for 5-10 s, and then they were confined in an actin filament-dependent manner without involvement of clathrin-coated pits or caveolae. Depletion of cholesterol dramatically reduced mobility of VLPs independently of actin, whereas inhibition of tyrosine kinases had no effect on confinement. The results suggested that clustering of ganglioside molecules by the multivalent VLPs induced transmembrane coupling that led to confinement of the virus/receptor complex by cortical actin filaments.


Figures

Fig. 1.
Fig. 1.
SPT of Py VLPs on the bottom surface of live 3T6 cells. (a) Electron micrograph of VLPs visualized by negative staining. (Scale bar, 0.1 μm.) (b) Epi-fluorescence micrograph of AF568-labeled VLPs bound to a live 3T6 cell (Scale bar, 10 μm.) (c) TIRF microscopy images from a time series (20 Hz, 1,000 frames) showing a single AF568-labeled VLP binding to a 3T6 cell. The arrow points to the blurred particle fluorescence detected one frame before binding. (Scale bar, 1 μm.) (d) TIRF microscopy images of VLPs colabeled with FITC and AF568 and bound to the bottom surface of live 3T6 cells 45 min after VLP addition to the coverslip. The cells are in a medium at either pH 7.0 (Left) or pH 4.5 (Right). Note that the FITC emission spectrum shifts upon acidification, rendering the FITC fluorescence of acid-exposed VLPs undetectable. (e)(Left) Differential interference contrast (DIC) image of the cell shown in d acquired after acidification of the medium. (Scale bar, 10 μm.) (Right) The trajectories (20 Hz, 1,000 frames) of surface-bound VLPs were acquired by detecting AF568 before acidification. (Scale bar, 2 μm.)
Fig. 2.
Fig. 2.
Analysis of VLP trajectories from live cells. (a) Scatter plot of the diffusion coefficient versus the slope of the MSS (D/SMSS) of VLP trajectories at the bottom surface of live cells. All harvested trajectories are plotted irrespective of the recorded length and whether the particles were bound or free at the start of the recording. Every point represents one trajectory and every trajectory is at least 100 steps (5 s) long. The longest trajectories are 2,000 steps (100 s) long. The three boxes highlight regions on the graph in which VLP motion is either rapid and random (box 1), confined (box 2), or confined with a slow drift (box 3). (b) Representative trajectories (numbered 1, 2, and 3) from each of the three boxes and one typical outlier (trajectory 4). The trajectories represent rapid and random movement (trajectory 1), confinement (trajectory 2) and confinement with a slow drift (trajectory 3). Trajectory 4 represents a VLP that changes its mode of motion during the acquisition time. Below each of these trajectories are the respective analytical plots: absolute displacement in μm for x and y direction versus time, MSD, and MSS. (c) D/SMSS scatter plot of trajectories from control experiments performed with VLPs bound to glass coverslips (Left) or to the top surface of cells (Right).
Fig. 3.
Fig. 3.
Analysis of the mobility of binding particles. The D and SMSS of particles imaged while binding to live cells were calculated separately for the mobile (black) and the confined (red) part of the trajectory (n = 10). The average positions on the D/SMSS plot for the mobile and confined part are shown in the respective colors. To illustrate the sudden change in mobility, D and SMSS were calculated for a moving window of 120 frames through the whole trajectory. The results of this analysis are graphed in a D/SMSS plot, and the data points are connected according to time for better visibility (see also Movie 5).
Fig. 4.
Fig. 4.
Confinement of VLPs on the cell surface does not require caveolae or clathrin-coated pits. TIRF images of AF568 VLPs bound to the bottom surface of live 3T6 cells expressing clathrin light chain–GFP (a) or caveolin-1–GFP (b). (Scale bars, 10 μm.) For each construct, a representative merged, dual-color image of a whole cell (Upper) and close-ups (insets in Upper shown in Lower) are shown. (c) D/SMSS plot of VLP trajectories from particles bound to lung fibroblasts obtained from caveolin-1 knockout mice.
Fig. 5.
Fig. 5.
Effect of perturbations of cellular actin and cholesterol on VLP motion. D/SMSS plots show VLP mobility when bound to cells in the presence of 0.2 μM latrunculin A added 15 min before the VLPs (a), 0.25 μM jasplakinolide added in the same way (b), 10 mM MCD added 1 h before the VLPs (c), 10 mM MCD–cholesterol complex added for 2 h to cells pretreated with MCD as in c (d), 0.2 μM latrunculin A for 15 min in cells pretreated as in c (e), and 0.2 mM genistein for 1 h added before the VLPs (f).

Similar articles

Cited by

References

    1. Saxton, M. J. & Jacobson, K. (1997) Annu. Rev. Biophys. Biomol. Struct. 26, 373–399. - PubMed
    1. Qian, H., Sheetz, M. P. & Elson, E. L. (1991) Biophys. J. 60, 910–921. - PMC - PubMed
    1. Vrljic, M., Nishimura, S. Y., Brasselet, S., Moerner, W. E. & McConnell, H. M. (2002) Biophys. J. 83, 2681–2692. - PMC - PubMed
    1. Sako, Y. & Kusumi, A. (1994) J. Cell Biol. 125, 1251–1264. - PMC - PubMed
    1. Kusumi, A., Nakada, C., Ritchie, K., Murase, K., Suzuki, K., Murakoshi, H., Kasai, R. S., Kondo, J. & Fujiwara, T. (2004) Annu. Rev. Biophys. Biomol. Struct. 34, 351–378. - PubMed

Publication types

MeSH terms