

Biological imaging by soft x-ray diffraction microscopy
- PMID: 16219701
- PMCID: PMC1250270
- DOI: 10.1073/pnas.0503305102
Biological imaging by soft x-ray diffraction microscopy
Abstract
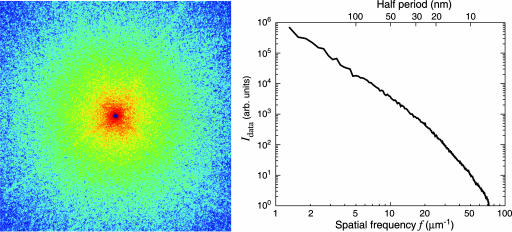
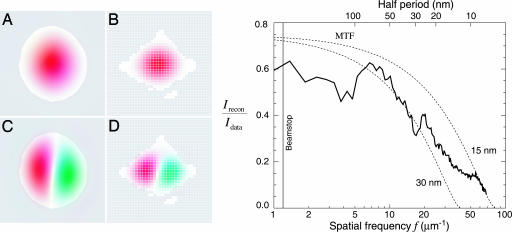
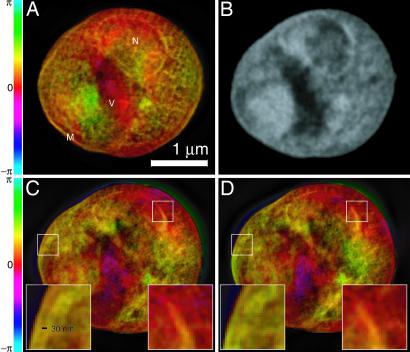
We have used the method of x-ray diffraction microscopy to image the complex-valued exit wave of an intact and unstained yeast cell. The images of the freeze-dried cell, obtained by using 750-eV x-rays from different angular orientations, portray several of the cell's major internal components to 30-nm resolution. The good agreement among the independently recovered structures demonstrates the accuracy of the imaging technique. To obtain the best possible reconstructions, we have implemented procedures for handling noisy and incomplete diffraction data, and we propose a method for determining the reconstructed resolution. This work represents a previously uncharacterized application of x-ray diffraction microscopy to a specimen of this complexity and provides confidence in the feasibility of the ultimate goal of imaging biological specimens at 10-nm resolution in three dimensions.
Figures
Similar articles
-
Soft X-ray diffraction microscopy of a frozen hydrated yeast cell.Phys Rev Lett. 2009 Nov 6;103(19):198101. doi: 10.1103/PhysRevLett.103.198101. Epub 2009 Nov 5. Phys Rev Lett. 2009. PMID: 20365955 Free PMC article.
-
High-resolution x-ray diffraction microscopy of specifically labeled yeast cells.Proc Natl Acad Sci U S A. 2010 Apr 20;107(16):7235-9. doi: 10.1073/pnas.0910874107. Epub 2010 Apr 5. Proc Natl Acad Sci U S A. 2010. PMID: 20368463 Free PMC article.
-
Quantitative 3D imaging of whole, unstained cells by using X-ray diffraction microscopy.Proc Natl Acad Sci U S A. 2010 Jun 22;107(25):11234-9. doi: 10.1073/pnas.1000156107. Epub 2010 Jun 4. Proc Natl Acad Sci U S A. 2010. PMID: 20534442 Free PMC article.
-
Single-Image Super-Resolution Improvement of X-ray Single-Particle Diffraction Images Using a Convolutional Neural Network.J Chem Inf Model. 2022 Jul 25;62(14):3352-3364. doi: 10.1021/acs.jcim.2c00660. Epub 2022 Jul 12. J Chem Inf Model. 2022. PMID: 35820663 Free PMC article. Review.
-
Assaying three-dimensional cellular architecture using X-ray tomographic and correlated imaging approaches.J Biol Chem. 2020 Nov 13;295(46):15782-15793. doi: 10.1074/jbc.REV120.009633. Epub 2020 Sep 16. J Biol Chem. 2020. PMID: 32938716 Free PMC article. Review.
Cited by
-
Full spatial characterization of a nanofocused x-ray free-electron laser beam by ptychographic imaging.Sci Rep. 2013;3:1633. doi: 10.1038/srep01633. Sci Rep. 2013. PMID: 23567281 Free PMC article.
-
Block Copolymer-Directed Single-Diamond Hybrid Structures Derived from X-ray Nanotomography.ACS Nano. 2024 Oct 1;18(39):26503-26513. doi: 10.1021/acsnano.3c10669. Epub 2024 Sep 16. ACS Nano. 2024. PMID: 39285511 Free PMC article.
-
Similarity score for screening phase-retrieved maps in X-ray diffraction imaging - characterization in reciprocal space.J Synchrotron Radiat. 2024 Jan 1;31(Pt 1):95-112. doi: 10.1107/S1600577523009827. Epub 2024 Jan 1. J Synchrotron Radiat. 2024. PMID: 38054944 Free PMC article.
-
A predicted model-aided reconstruction algorithm for X-ray free-electron laser single-particle imaging.IUCrJ. 2024 Jul 1;11(Pt 4):602-619. doi: 10.1107/S2052252524004858. IUCrJ. 2024. PMID: 38904548 Free PMC article.
-
Radiation dose reduction and image enhancement in biological imaging through equally-sloped tomography.J Struct Biol. 2008 Nov;164(2):221-7. doi: 10.1016/j.jsb.2008.07.011. Epub 2008 Aug 15. J Struct Biol. 2008. PMID: 18771735 Free PMC article.
References
-
- Sayre, D. (1980) in Imaging Processes and Coherence in Physics, eds. Schlenker, J., Fink, M., Goedgebuer, J. P., Malgrange, C., Viénot, J. C. & Wade, R. H. (Springer, Berlin), Vol. 112, pp. 229-235.
-
- Sayre, D., Chapman, H. N. & Miao, J. (1998) Acta Crystallogr. A 54, 232-239.
-
- Miao, J., Charalambous, P., Kirz, J. & Sayre, D. (1999) Nature 400, 342-344.
-
- Miao, J. W., Ishikawa, T., Johnson, B., Anderson, E. H., Lai, B. & Hodgson, K. O. (2002) Phys. Rev. Lett. 89, 088303. - PubMed
-
- Williams, G. J., Pfeifer, M. A., Vartanyants, I. A. & Robinson, I. K. (2003) Phys. Rev. Lett. 90, 175501. - PubMed
Publication types
MeSH terms
LinkOut - more resources
Full Text Sources
Other Literature Sources
Molecular Biology Databases
