

Lysis timing and bacteriophage fitness
- PMID: 16219778
- PMCID: PMC1456144
- DOI: 10.1534/genetics.105.045922
Lysis timing and bacteriophage fitness
Abstract
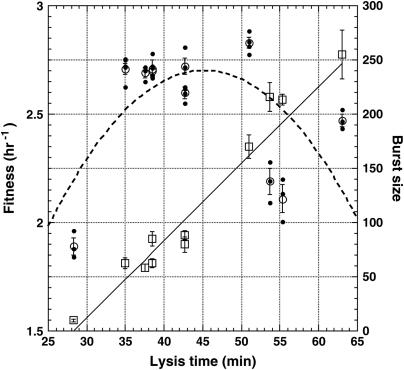
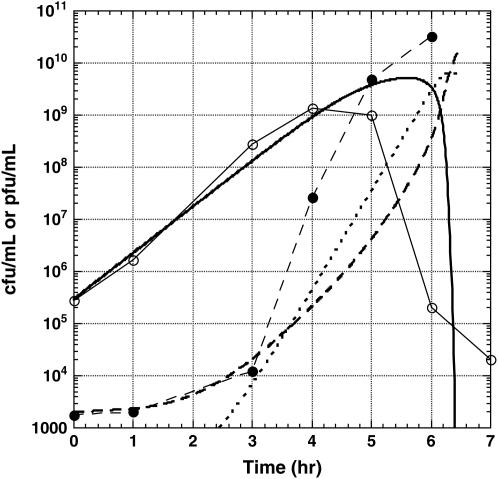
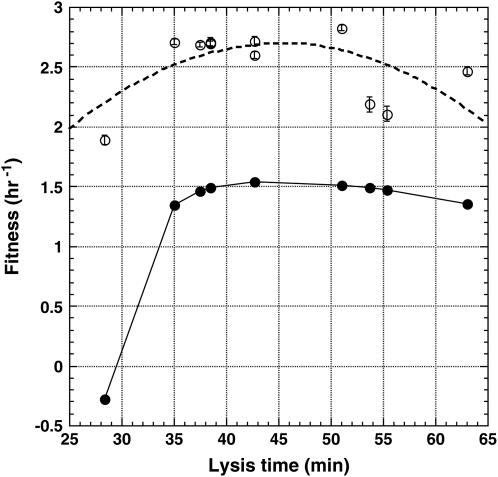
The effect of lysis timing on bacteriophage (phage) fitness has received little theoretical or experimental attention. Previously, the impact of lysis timing on phage fitness was studied using a theoretical model based on the marginal value theorem from the optimal foraging theory. An implicit conclusion of the model is that, for any combination of host quantity and quality, an optimal time to lyse the host would exist so that the phage fitness would be the highest. To test the prediction, an array of isogenic lambda-phages that differ only in their lysis times was constructed. For each phage strain, the lysis time, burst size, and fitness (growth rate) were determined. The result showed that there is a positive linear relationship between lysis time and burst size. Moreover, the strain with an intermediate lysis time has the highest fitness, indicating the existence of an optimal lysis time. A mathematical model is also constructed to describe the population dynamics of phage infection. Computer simulations using parameter values derived from phage lambda-infection also showed an optimal lysis time. However, both the optimum and the fitness are different from the experimental result. The evolution of phage lysis timing is discussed from the perspectives of multiple infection and life-history trait evolution.
Figures
Similar articles
-
Effect of late promoter activity on bacteriophage lambda fitness.Genetics. 2009 Apr;181(4):1467-75. doi: 10.1534/genetics.108.098624. Epub 2009 Jan 26. Genetics. 2009. PMID: 19171945 Free PMC article.
-
An Optimal Lysis Time Maximizes Bacteriophage Fitness in Quasi-Continuous Culture.mBio. 2022 Jun 28;13(3):e0359321. doi: 10.1128/mbio.03593-21. Epub 2022 Apr 25. mBio. 2022. PMID: 35467417 Free PMC article.
-
Evolutionary robustness of an optimal phenotype: re-evolution of lysis in a bacteriophage deleted for its lysin gene.J Mol Evol. 2005 Aug;61(2):181-91. doi: 10.1007/s00239-004-0304-4. Epub 2005 Jul 26. J Mol Evol. 2005. PMID: 16096681
-
Why Be Temperate: Lessons from Bacteriophage λ.Trends Microbiol. 2016 May;24(5):356-365. doi: 10.1016/j.tim.2016.02.008. Epub 2016 Mar 3. Trends Microbiol. 2016. PMID: 26946976 Review.
-
Phage λ--new insights into regulatory circuits.Adv Virus Res. 2012;82:155-78. doi: 10.1016/B978-0-12-394621-8.00016-9. Adv Virus Res. 2012. PMID: 22420854 Review.
Cited by
-
An enhanced bioindicator for calorimetric monitoring of prophage-activating chemicals in the trace concentration range.Eng Life Sci. 2018 Jun 1;18(7):475-483. doi: 10.1002/elsc.201800026. eCollection 2018 Jul. Eng Life Sci. 2018. PMID: 32624928 Free PMC article.
-
Mechanisms that Determine the Differential Stability of Stx⁺ and Stx(-) Lysogens.Toxins (Basel). 2016 Mar 31;8(4):96. doi: 10.3390/toxins8040096. Toxins (Basel). 2016. PMID: 27043626 Free PMC article.
-
Prophylactic Bacteriophage Administration More Effective than Post-infection Administration in Reducing Salmonella enterica serovar Enteritidis Shedding in Quail.Front Microbiol. 2016 Aug 9;7:1253. doi: 10.3389/fmicb.2016.01253. eCollection 2016. Front Microbiol. 2016. PMID: 27555842 Free PMC article.
-
Accounting for cellular-level variation in lysis: implications for virus-host dynamics.mBio. 2024 Aug 14;15(8):e0137624. doi: 10.1128/mbio.01376-24. Epub 2024 Jul 19. mBio. 2024. PMID: 39028198 Free PMC article.
-
Transcriptional analysis in bacteriophage Fc02 of Pseudomonas aeruginosa revealed two overlapping genes with exclusion activity.Front Microbiol. 2023 Feb 3;14:1027380. doi: 10.3389/fmicb.2023.1027380. eCollection 2023. Front Microbiol. 2023. PMID: 36819063 Free PMC article.
References
-
- Abedon, S. T., 1989. Selection for bacteriophage latent period length by bacterial density: a theoretical examination. Microb. Ecol. 18: 79–88. - PubMed
-
- Adams, M. H., 1959. Bacteriophages. Interscience Publishers, New York.
Publication types
MeSH terms
Grants and funding
LinkOut - more resources
Full Text Sources
Other Literature Sources
