. 2006 Jan;172(1):713-8.
doi: 10.1534/genetics.105.044065. Epub 2005 Oct 11.

Directional positive selection on an allele of arbitrary dominance

Affiliations

Directional positive selection on an allele of arbitrary dominance

Kosuke M Teshima et al. Genetics. 2006 Jan.

Abstract

Most models of positive directional selection assume codominance of the beneficial allele. We examine the importance of this assumption by implementing a coalescent model of positive directional selection with arbitrary dominance. We find that, for a given mean fixation time, a beneficial allele has a much weaker effect on diversity at linked neutral sites when the allele is recessive.


Figures

Figure 1.
Figure 1.
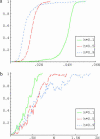
The average fixation time of a favorable allele for different dominance coefficients. The scaled selection coefficient formula image is on the x-axis and the fixation time in generations is on the y-axis. N is the diploid effective population size. The mean fixation time of a neutral allele is 4N generations. The solid line (green) is for h = 0.1, the long dashed line (red) is for h = 0.5, and the short dashed line (blue) is for h = 0.9. The inset is an enlarged view of the trajectories when selection is strong.
Figure 2.
Figure 2.
Examples of the trajectory of the favored allele from introduction to fixation. (a) σ = 4000; (b) σ = 50. Time scaled by the population size is on the x-axis and the frequency of the favored allele is on the y-axis. The solid line (green) is for h = 0.1, the long dashed line (red) is for h = 0.5, and the short dashed line (blue) is for h = 0.9.
Figure 3.
Figure 3.
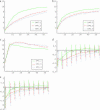
The effect of strong directional selection. Average (a) θπ, (b) θW, and (c) θH are shown as functions of the distance (in kilobases) from the selected site, for different dominance coefficients. (d) Mean, 25th, and 75th percentiles of Tajima's D; (e) mean, 25th, and 75th percentiles of Fu and Li's D. Parameters are formula image, formula image. The solid line (green) is for h = 0.1, the long dashed line (red) is for h = 0.5, and the short dashed line (blue) is for h = 0.9.
Figure 4.
Figure 4.
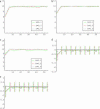
The effect of weak directional selection. Average (a) θπ, (b) θW, and (c) θH are shown as functions of the distance (in kilobases) from the selected site, for different dominance coefficients. (d) Mean, 25th, and 75th percentiles of Tajima's D; (e) mean, 25th, and 75th percentiles of Fu and Li's D. Parameters are formula image, formula image, formula image. The solid line (green) is for h = 0.1, the long dashed line (red) is for h = 0.5, and the short dashed line (blue) is for h = 0.9.

Similar articles

Cited by

References

    1. Andolfatto, P., and M. Przeworski, 2000. A genome-wide departure from the standard neutral model in natural populations in Drosophila. Genetics 156: 257–268. - PMC - PubMed
    1. Barton, N. H., 1998. The effect of hitch-hiking on neutral genealogies. Genet. Res. 72: 123–133.
    1. Begun, D. J., and P. Whitley, 2000. Reduced X-linked nucleotide polymorphism in Drosophila simulans. Proc. Natl. Acad. Sci. USA 97: 5960–5965. - PMC - PubMed
    1. Betancourt, A. J., Y. Kim and H. A. Orr, 2004. A pseudo-hitchhiking model of X vs. autosomal diversity. Genetics 168: 2261–2269. - PMC - PubMed
    1. Coop, G., and R. C. Griffiths, 2004. Ancestral inference on gene trees under selection. Theor. Popul. Biol. 66: 219–232. - PubMed

Publication types