Comparative Study
. 2006;67(1):39-52.
doi: 10.1159/000088857. Epub 2005 Oct 10.

The eye of the laboratory mouse remains anatomically adapted for natural conditions

Affiliations
Comparative Study

The eye of the laboratory mouse remains anatomically adapted for natural conditions

Jonathan M Shupe et al. Brain Behav Evol. 2006.

Abstract

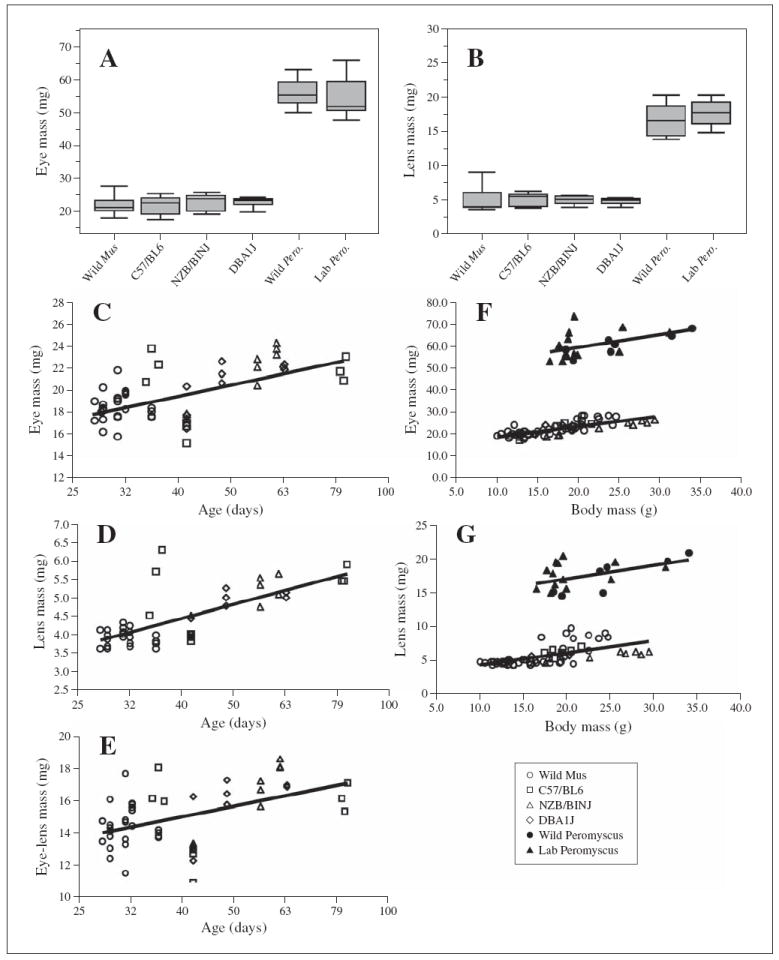
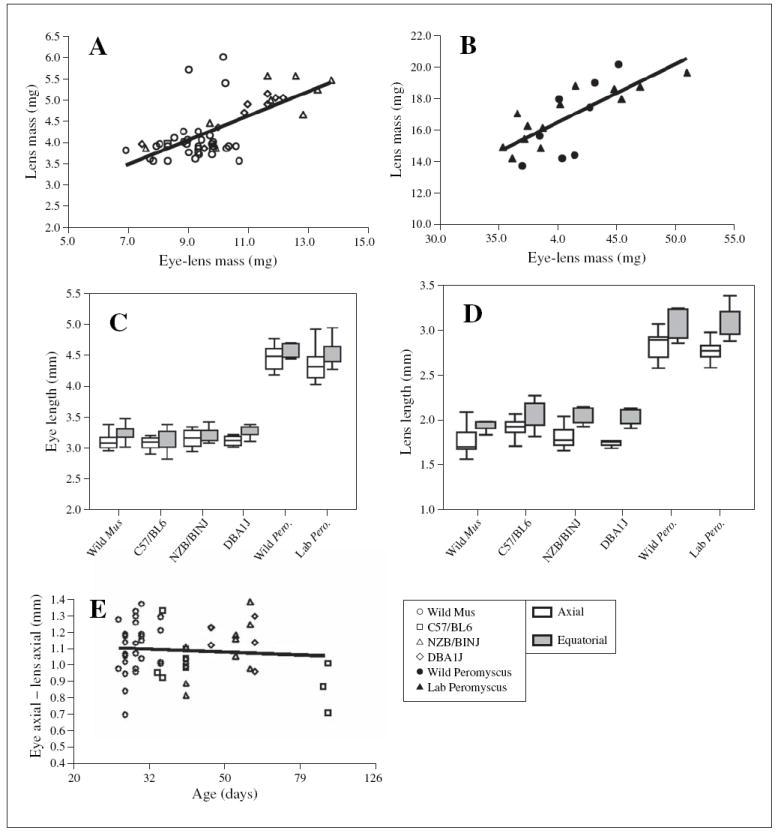
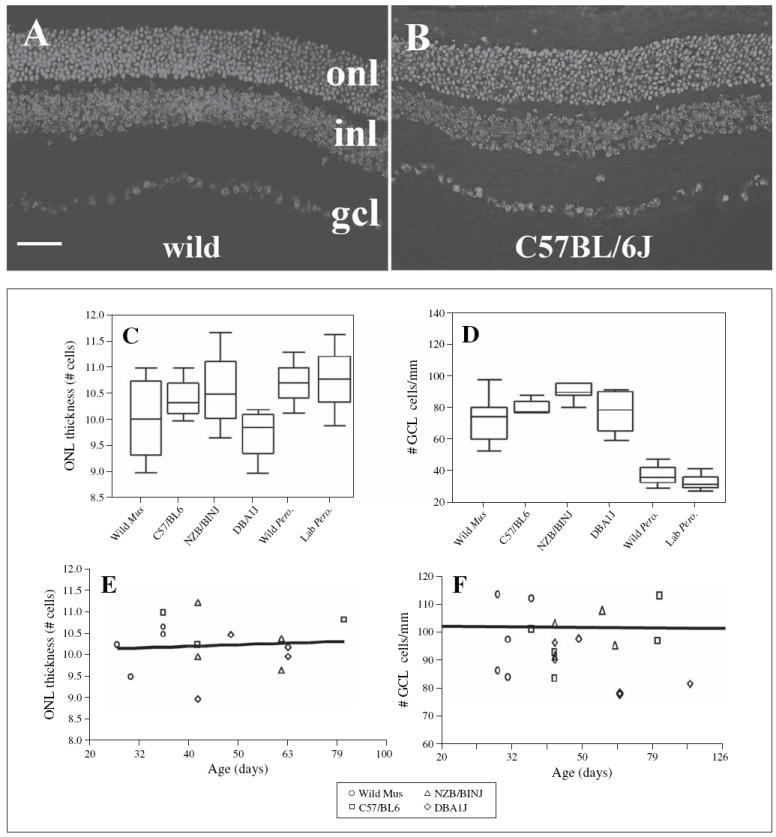
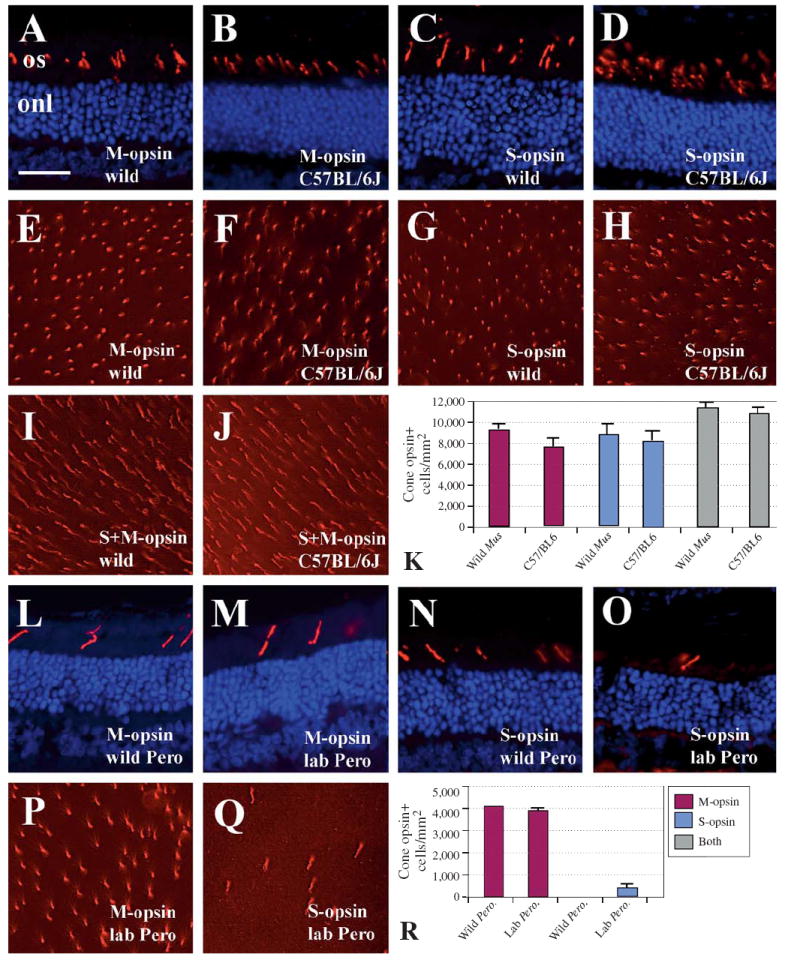
Evolutionary effects of domestication have been demonstrated for several body systems, including the eye, and for several vertebrate species, including the mouse. Given the importance of the laboratory mouse to vision science, we wished to determine whether the anatomical and histological features of the eyes of laboratory mice are distinct from those of their naturally adapted, wild counterparts. We measured dimensions and masses of whole eyes and lenses from a wild population plus three inbred strains (C57BL/6J, NZB/BINJ, and DBA/1J) of the house house, Mus musculus, as well as wild and outbred laboratory-domesticated stock of the deer mouse, Peromyscus maniculatus. Histological preparations from these eyes were used to determine outer nuclear layer thickness, linear density of the ganglion cell layer, and for indirect immunofluorescence evaluation of cone opsin expression. For all of these traits, no statistically significant differences were found between any laboratory strain and its wild counterpart. The evolutionary effects of domestication of mice therefore do not include changes to the eye in any variable measured, supporting the continued use of this animal as a model for a naturally adapted visual system.


Figures

Fig. 1
Fig. 1
Eye and lens masses for wild and laboratory strains of M. musculus and P. maniculatus. A Box plot of eye masses for wild and laboratory strains (box stretches from the 25th percentile to the 75th percentile; the median is a line across the box; box lies between minimum and maximum values). B Box plot of lens masses for wild and laboratory strains. CE Regression analysis of eye mass (C), lens mass (D), and eye mass minus lens mass (E) as a function of the log of age (although actual age is indicated on the figure); each symbol represents data collected from a single mouse. All data shown are from M. musculus strains. F, G Regression analysis of eye mass (F) and lens mass (G) as a function of body mass for wild and laboratory M. musculus strains.
Fig. 2
Fig. 2
Size relationships between eyes and lenses for wild and laboratory strains of M. musculus and P. maniculatus. A, B Regression analysis of lens mass as a function of the mass of the eye excluding the lens; each symbol represents data collected from a single mouse. A Wild and laboratory strains of M. musculus. B Wild and laboratory P. maniculatus. C Box plots of eye lengths in the axial and equatorial dimensions for wild and laboratory strains of M. musculus and P. maniculatus. D Box plot of lens lengths in the axial and equatorial dimensions for wild and laboratory strains of M. musculus and P. maniculatus. E Regression analysis of eye axial length excluding the axial length of the lens (approximation of cornea thickness plus depth of the vitreous chamber) as a function of the log of age (although actual age is indicated on the figure); each symbol represents data collected from a single mouse.
Fig. 3
Fig. 3
Retinal histology and retinal cell numbers in wild and laboratory strains of M. musculus and P. maniculatus. A DAPI-labeled retinal cryosection obtained from a wild-trapped M. musculus. Bar (applies to A and B) = 50 μm. B DAPI-labeled retinal cryosection obtained from a C57BL/6J mouse; onl, outer nuclear layer; inl, inner nuclear layer; gcl, ganglion cell layer. C Box plots representing numbers of rows of nuclei in the ONL for all wild and laboratory strains. D Box plots representing linear density of cells in the GCL for all wild and laboratory strains. E Regression analysis of ONL thickness as a function of the log of age for wild and laboratory strains of M. musculus; each symbol represents data collected from a single mouse. F Regression analysis of cell density in the GCL as a function of the log of age (although actual age is indicated in the figure) for wild and laboratory strains of M. musculus.
Fig. 4
Fig. 4
Cone photoreceptor densities in wild and laboratory M. musculus (AK) and P. maniculatus (LR). AD Confirmation that cone opsin antibodies (Chemicon) specifically label outer segments of cone photoreceptors (red label) in wild M. musculus. Blue label is a DAPI nuclear counterstain; onl, outer nuclear layer; os, outer segments. Bar in A (= 50 μm) applies to all images in figure. A M-cone antibody; retinal cryosection from wild mouse. B M-cone antibody, C57BL/6J. C S-cone antibody, wild mouse. D S-cone antibody, C57BL/6J. EJ Retinal whole mounts labeled with anti-M-opsin, anti-S-opsin, or the combination. E M-cone antibody, wild mouse. F M-cone antibody, C57BL/6J. G S-cone antibody, wild mouse. H S-cone antibody, C57BL/6J. I Combination of M- and S-cone antibodies, wild mouse. J Combination of M- and S-cone antibodies, C57BL/6J. K Densities of cone labeling in two strains of M. musculus. Columns depict means plus SEM. Legend is shown in panel R. LO Confirmation that cone opsin antibodies (Chemicon) specifically label outer segments of cone photoreceptors (red label) in wild P. maniculatus. L M-cone antibody; retinal cryosection from wild P. maniculatus. M M-cone antibody, laboratory P. maniculatus. N S-cone antibody, wild P. maniculatus. O S-cone antibody, laboratory P. maniculatus. PQ Retinal whole mounts of laboratory P. maniculatus labeled with anti-M opsin (P) and anti-S opsin (Q). R Densities of cone labeling in two strains of P. maniculatus. Columns depict means ± SEM.

References

    1. Anderson RS, Zlatkova MB, Demirel S. What limits detection and resolution of short-wavelength sinusoidal gratings across the retina? Vision Res. 2002;42:981–990. - PubMed
    1. Applebury ML, Antoch MP, Baxter LC, Chun LL, Falk JD, Farhangfar F, Kage K, Krzystolik MG, Lyass LA, Robbins JT. The murine cone photoreceptor: a single cone type expresses both S and M opsins with retinal spatial patterning. Neuron. 2000;27:513–523. - PubMed
    1. Augustsson H, Meyerson BJ. Exploration and risk assessment: a comparative study of male house mice (Mus musculus musculus) and two laboratory strains. Physiol Behav. 2004;81:685–698. - PubMed
    1. Austad SN. A mouse’s tale. Nat Hist. 2002;111:64–70.
    1. Chang B, Hawes NL, Hurd RE, Davisson MT, Nusinowitz S, Heckenlively JR. Retinal degeneration mutants in the mouse. Vision Res. 2002;42:517–525. - PubMed

Publication types