Comparative Study
. 2005 Oct 12;25(41):9398-405.
doi: 10.1523/JNEUROSCI.2149-05.2005.

Pattern-specific associative long-term potentiation induced by a sleep spindle-related spike train

Affiliations
Comparative Study

Pattern-specific associative long-term potentiation induced by a sleep spindle-related spike train

Mario Rosanova et al. J Neurosci. .

Abstract

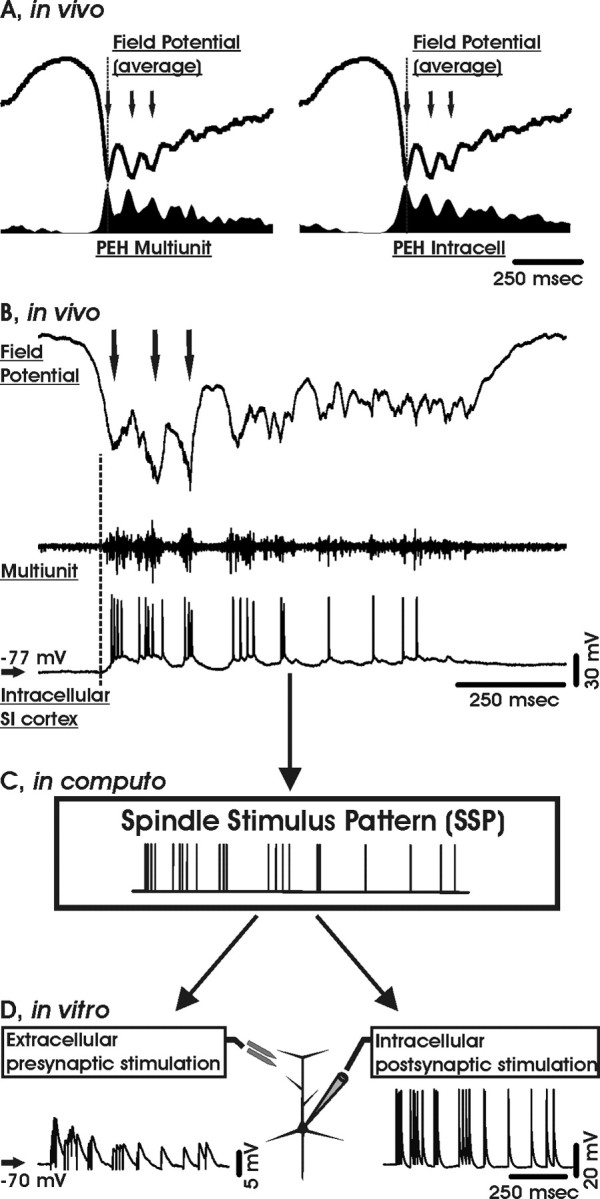
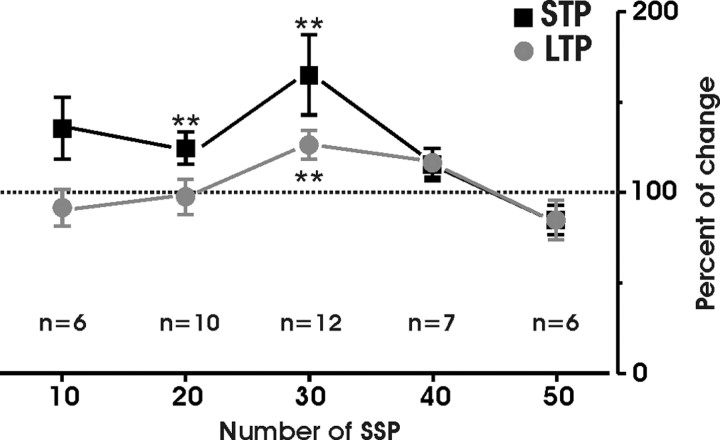
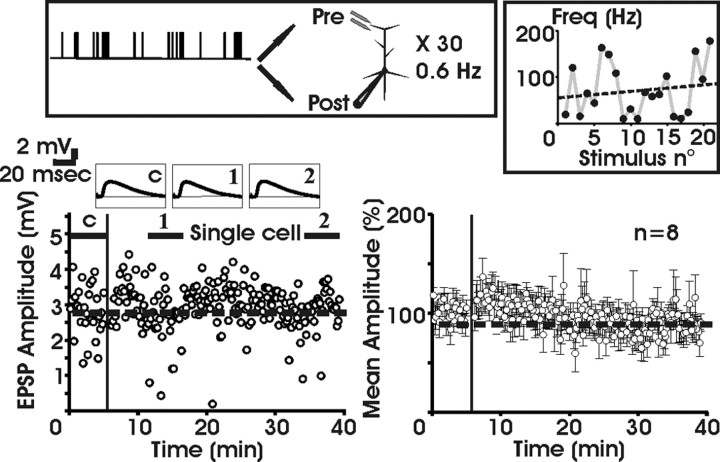
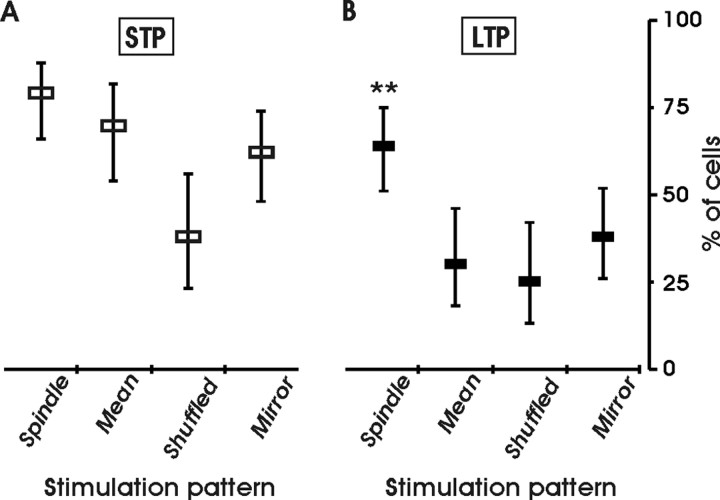
Spindles are non-rapid eye movement (non-REM) sleep EEG rhythms (7-14 Hz) that occur independently or in association with slow oscillations (0.6-0.8 Hz). Despite their proposed function in learning and memory, their role in synaptic plasticity is essentially unknown. We studied the ability of a neuronal firing pattern underlying spindles in vivo to induce synaptic plasticity in neocortical pyramidal cells in vitro. A spindle stimulation pattern (SSP) was extracted from a slow oscillation upstate that was recorded in a cat anesthetized with ketamine-xylazine, which is known to induce a sleep-like state. To mimic the recurrence of spindles grouped by the slow oscillation, the SSP was repeated every 1.5 s (0.6 Hz). Whole-cell patch-clamp recordings were obtained from layer V pyramidal cells of rat somatosensory cortex with infrared videomicroscopy, and composite EPSPs were evoked within layers II-III. Trains of EPSPs and action potentials simultaneously triggered by the SSP induced an NMDA receptor-dependent short-term potentiation (STP) and an L-type Ca2+ channel-dependent long-term potentiation (LTP). The number of spindle sequences affected the amount of STP-LTP. In contrast, spindle trains of EPSPs alone led to long-term depression. LTP was not consistently induced by a regular firing pattern, a mirrored SSP, or a randomized SSP; however, a synthetic spindle pattern consisting of repetitive spike bursts at 10 Hz reliably induced STP-LTP. Our results show that spindle-associated spike discharges are efficient in modifying excitatory neocortical synapses according to a Hebbian rule. This is in support of a role for sleep spindles in memory consolidation.


Figures

Figure 1.
Figure 1.
The spindle stimulus pattern. A, Average local field potentials and peri-event histograms (PEH) of multiunit (left) and intracellular (right) spike activity simultaneously obtained in vivo from the primary somatosensory (SI) cortex of a cat anesthetized with ketamine-xylazine. The graphs are aligned to the onset (dashed line) of three spindle oscillations (arrows). B, Individual local field, multiunit, and intracellular recordings from the same experiment as in A. The selected segment shows an upstate emerging from the depolarizing phase of the slow oscillation cycle (vertical dashed line) that contains a spindle sequence (three oscillations at 10 Hz indicated by arrows). Note that the cell is bursting concomitantly with the spindle oscillations. C, Raster plot derived from the SSP. D, Sample trains of EPSPs (left) and action potentials (right) evoked by a single SSP.
Figure 2.
Figure 2.
SSP-induced short- and long-term potentiations. A, Experimental arrangement. During the induction protocol, EPSPs and action potentials were elicited synchronously. B, Instantaneous frequency (Freq) content of the SSP. The dashed line represents a linear fit to the data points (r =-0.5; p < 0.03). C, Time series of EPSP amplitudes from an individual cell in control and after conditioning with an SSP (vertical line). Insets, Sample EPSPs (averages of 30) in control (dashed line) and at two different time points (1, 2) after conditioning as indicated in A. D, Amplitude time series of the average normalized EPSPs (mean ± SEM; n = 14). Bar histogram indicates the average (mean ± SEM) STP and LTP potentiation. **p < 0.01. Pre, Presynaptic; Post, postsynaptic.
Figure 3.
Figure 3.
STP and LTP depend on the number of SSPs. Relative magnitude (mean ± SEM) of STP(black squares) and LTP (gray circles) versus the number of conditioning SSPs is shown. Note that only 30 repetitions were able to induce a statistically significant LTP. **p < 0.03.
Figure 4.
Figure 4.
Associativity of SSP-induced STP and LTP. A, Left, Sample traces of averaged EPSPs (insets: control, 1, 2) and amplitude time series in control and after the conditioning protocol (vertical black bar). Only the postsynaptic cell was stimulated by the SSP (30×; 0.6 Hz). Right, Time course of the average EPSP amplitude (±SEM; n = 7). B, Left, Sample EPSPs (insets: control, 1, 2) and amplitude time series from an individual cell before and after a conditioning protocol with only presynaptic EPSPs triggered by the SSP (vertical black bar). Right, Time series of the average normalized (±SEM; n = 9) EPSP amplitudes. Note that with presynaptic conditioning stimuli in isolation, there is a significant LTD. c, Control; Pre, presynaptic; Post, postsynaptic.
Figure 5.
Figure 5.
SSP-induced STP depends on NMDA receptors and LTP depends on L-type calcium channels. A, Left, Sample traces (insets: control, 1, 2) and amplitude time course of EPSPs recorded before and after the SSP conditioning protocol (vertical black bar) in the presence of 50 μm dl-APV. Right, Time series plot of the average normalized EPSP (±SEM; n = 13) in dl-APV. B, Left, Sample EPSPs (insets: control, 1, 2) and EPSP amplitude time series in the presence of 10 μm nifedipine. Right, Average time course of normalized EPSPs with nifedipine (±SEM; n = 9). C, Left, Sample EPSPs (insets: control, 1, 2) and EPSP amplitude time series in the presence of nifedipine and dl-APV. Right, Average time course of all normalized EPSPs with nifedipine and dl-APV (±SEM; n = 6). c, Control.
Figure 6.
Figure 6.
Rhythmic discharges favor STP-LTP. A, Left, Sample EPSPs (insets: control, 1, 2) and EPSP amplitude time course from an individual cell conditioned by three high-frequency (Freq) spike bursts (vertical black bar). Right, Time course of the averaged normalized EPSPs (±SEM; n = 7). B, Left, Sample EPSPs (insets: control, 1, 2) and EPSP amplitude time course from an individual cell with a regular spike train as the conditioning stimulus (vertical black bar). Right, Time course of the averaged normalized EPSPs (±SEM; n = 10). Pre, Presynaptic; Post, postsynaptic; c, control.
Figure 7.
Figure 7.
STP-LTP are pattern sensitive. Left, Sample EPSPs (insets: control, 1, 2) and EPSP amplitude time course before and after conditioning with a shuffled SSP (top left panel). Top right panel, Instantaneous frequency (Freq) plot of the shuffled SSP fit with a straight line (dashed line; r = 0.15; p > 0.5). Right, Average time course of normalized EPSPs conditioned with the shuffled SSP (±SEM; n = 8). Pre, Presynaptic; Post, postsynaptic; c, control.
Figure 8.
Figure 8.
SSP pattern specificity. A, Left, Sample EPSPs (insets: control, 1, 2) and EPSP amplitude time course from an individual cell before and after conditioning with the mirrored SSP (vertical black bar). Right, Amplitude time course of the average normalized EPSPs (±SEM; n = 13). Top panels, Experimental arrangement and instantaneous frequency (Freq) content of the mirrored SSP. The dashed line represents the linear fit to the data points (r = 0.5; p < 0.03). B, Left, Sample EPSPs (insets: control, 1, 2) and amplitude time course before and after conditioning with the mirrored SSP (white circles) followed by a second conditioning with the original SSP (gray circles). Right, Amplitude time series of all normalized EPSPs (±SEM; n = 6) that underwent the dual conditioning protocol. Pre, Presynaptic; Post, postsynaptic; c, control.
Figure 9.
Figure 9.
Efficacy of different firing patterns for STP-LTP induction. Summary bar plot of the fraction of cells (mean + 1 SD confidence interval) that underwent significant STP (A) or LTP (B) for the different conditioning firing patterns. **p < 0.05 (Fisher's exact test).

References

    1. Achermann P, Borbély AA (1997) Low-frequency (<1 Hz) oscillations in the human sleep electroencephalogram. Neuroscience 81: 213-222. - PubMed
    1. Akaike N, Hattori K, Oomura Y, Carpenter DO (1985) Bicuculline and picrotoxin block gamma-aminobutyric acid-gated Cl- conductance by different mechanisms. Experientia 41: 70-71. - PubMed
    1. Allen CB, Celikel T, Feldman DE (2003) Long-term depression induced by sensory deprivation during cortical map plasticity in vivo. Nat Neurosci 6: 291-299. - PubMed
    1. Amzica F, Steriade M (1995) Disconnection of intracortical synaptic linkages disrupts synchronization of a slow oscillation. J Neurosci 15: 4658-4677. - PMC - PubMed
    1. Amzica F, Steriade M (1997) The K-complex: its slow (<1-Hz) rhythmicity and relation to delta waves. Neurology 49: 952-959. - PubMed

Publication types

LinkOut - more resources