. 2005 Dec 15;569(Pt 3):761-72.
doi: 10.1113/jphysiol.2005.098962. Epub 2005 Oct 13.

The neurotransmitters glycine and GABA stimulate glucagon-like peptide-1 release from the GLUTag cell line

Affiliations

The neurotransmitters glycine and GABA stimulate glucagon-like peptide-1 release from the GLUTag cell line

A Gameiro et al. J Physiol. .

Abstract

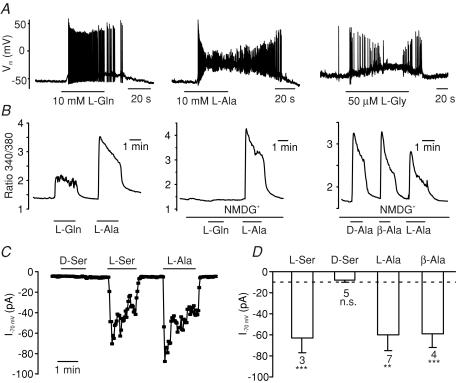
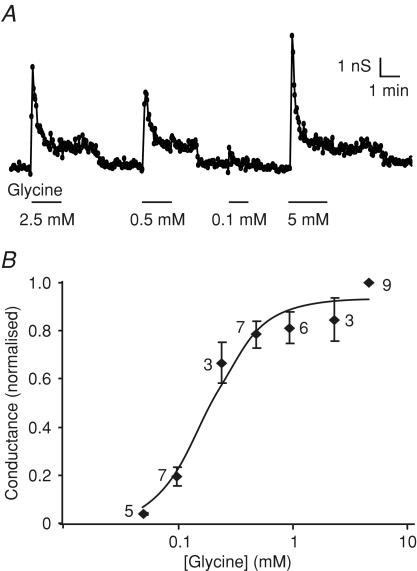
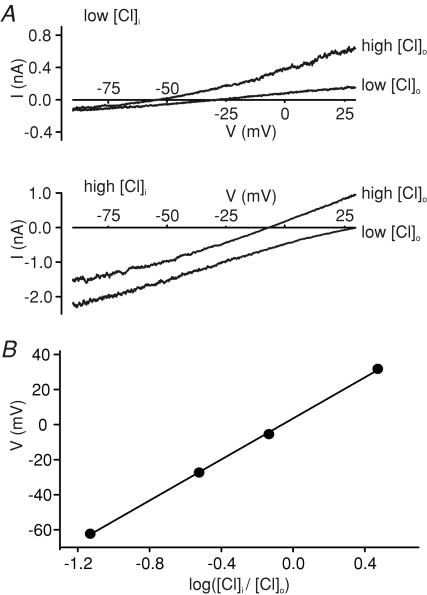
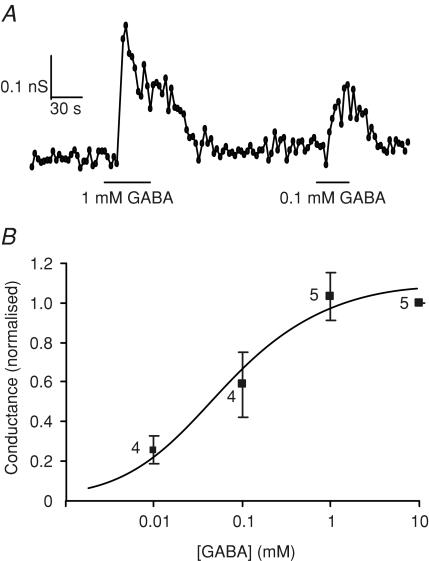
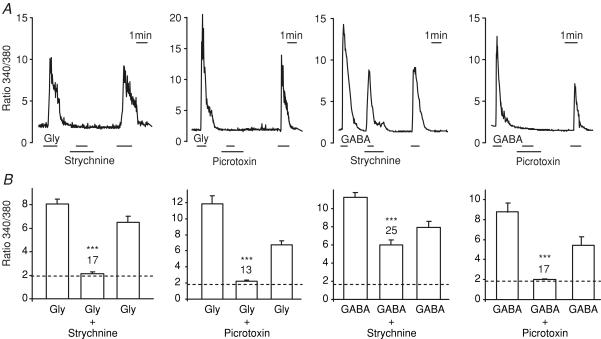
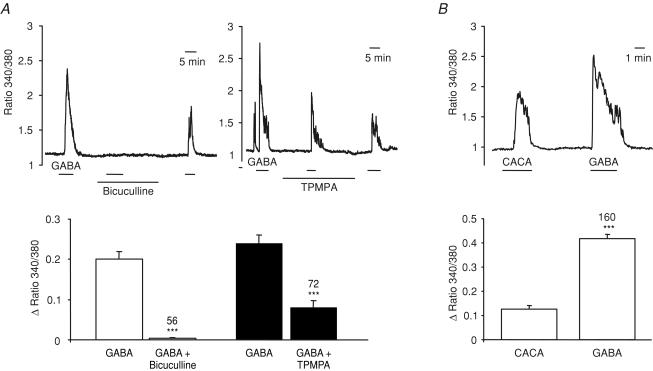
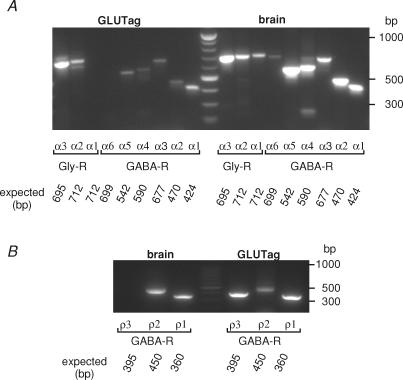
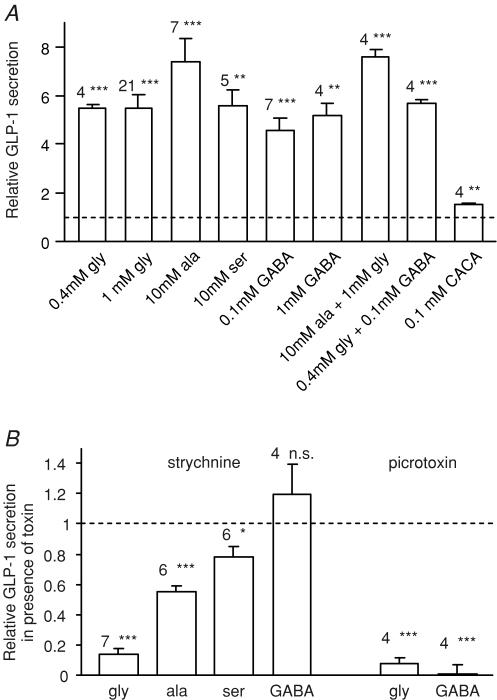
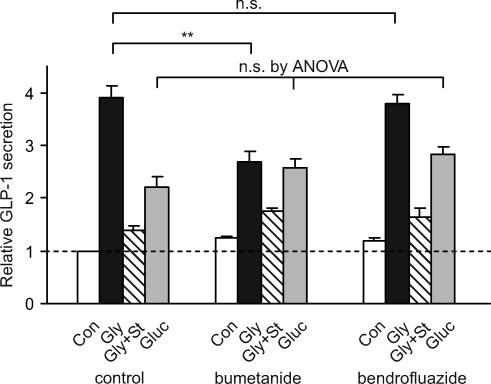
The incretin hormone, glucagon-like peptide-1 (GLP-1) is released from intestinal L-cells following food ingestion. Its secretion is triggered by a range of nutrients, including fats, carbohydrates and proteins. We reported previously that Na(+)-dependent glutamine uptake triggered electrical activity and GLP-1 release from the L-cell model line GLUTag. However, whereas alanine also triggered membrane depolarization and GLP-1 secretion, the response was Na+ independent. A range of alanine analogues, including d-alanine, beta-alanine, glycine and l-serine, but not d-serine, triggered similar depolarizing currents and elevation of intracellular [Ca2+], a sensitivity profile suggesting the involvement of glycine receptors. In support of this idea, glycine-induced currents and GLP-1 release were blocked by strychnine, and currents showed a 58.5 mV shift in reversal potential per 10-fold change in [Cl-], consistent with the activation of a Cl(-)-selective current. GABA, an agonist of related Cl- channels, also triggered Cl- currents and secretion, which were sensitive to picrotoxin. GABA-triggered [Ca2+]i increments were abolished by bicuculline and partially impaired by (1,2,5,6-tetrahydropyridine-4-yl)methylphosphinic acid (TPMPA), suggesting the involvement of both GABA(A) and GABA(C) receptors. Expression of GABA(A), GABA(C) and glycine receptor subunits was confirmed by RT-PCR. Glycine-triggered GLP-1 secretion was impaired by bumetanide but not bendrofluazide, suggesting that a high intracellular [Cl-] maintained by Na(+)-K(+)-2Cl- cotransporters is necessary for the depolarizing response to glycine receptor ligands. Our results suggest that GABA and glycine stimulate electrical activity and GLP-1 release from GLUTag cells by ligand-gated ion channel activation, a mechanism that might be important in responses to endogenous ligands from the enteric nervous system or dietary sources.


Figures

Figure 1
Figure 1. Sensitivity of GLUTag cells to structural analogues of alanine
A, action potentials triggered by l-glutamine (L-Gln, 10 mm), l-alanine (L-Ala, 10 mm) and l-glycine (L-Gly, 50 μm) in perforated-patch recordings of GLUTag cells. B, intracellular Ca2+ concentrations, monitored as the ratio of the fluorescence at 340 and 380 nm in fura-2-loaded cells. l-Glutamine, l-alanine, d-alanine and β-alanine (all at 10 mm) were added at the times shown by the horizontal bars. Substitution of Na+ with N-methyl-d-glucamine (NMDG+) in the bath solution abolished the effect of l-glutamine, but did not affect responses to l-alanine, d-alanine or β-alanine. C, l-serine, l-alanine and β-alanine, but not d-serine, triggered inward currents (I) at a holding potential of −70 mV in standard whole-cell recordings of GLUTag cells. D, mean currents at −70 mV for cells recorded as in C. The dashed line indicates the mean current in the absence of amino acids, and the numbers of cells are indicated below each bar. ***P < 0.001, **P < 0.01; n.s., not significant, in comparison with the mean background current.
Figure 2
Figure 2. Dose–response relationship for currents triggered by glycine
A, slope conductance in response to a series of voltage ramps between −90 and −40 mV measured in a cell in standard whole-cell recording mode. Different glycine concentrations were applied as indicated. B, mean slope conductance of five ramps at each glycine concentration was calculated and the mean of the control conductances measured before and after each test application was subtracted. Data were normalized to the 5 mm glycine response, measured on the same patch. The numbers of cells are indicated next to the data points. Data were fitted with a Hill equation, with an EC50 of 0.2 mm and Hill coefficient of 1.9.
Figure 3
Figure 3. Glycine-induced currents are dependent on the Cl gradient
A, current–voltage relationships for currents triggered by 100 μm glycine in the presence of different combinations of low and high [Cl] in the patch pipette (low [Cl]i, high [Cl]i) and bath solution (low [Cl]o, high [Cl]o). The estimated chloride concentrations of the different solutions were (mm): low [Cl]i∼12, high [Cl]i∼119, low [Cl]o∼40, high [Cl]o∼162. Recordings were made in standard whole-cell mode, in response to a voltage ramp from −90 to +50 mV, and the response to a single voltage ramp is shown for each condition. Corrections were made for liquid junction potentials, as calculated by the program JPCalc within the pCLAMP software. Control current responses, recorded immediately prior to glycine addition, were subtracted. Voltage-gated cation currents were blocked by TEA+, 4-aminopyridine (4-AP), TTX, Co2+ and Cs+. B, relationship between the reversal potential (V) and log([Cl]i/[Cl]o) for cells recorded as in A (n = 5 for each data point). Error bars are obscured by the data points. The data were best fitted with a straight line of gradient 58.5 mV.
Figure 4
Figure 4. Dose–response relationship for currents triggered by GABA
A, slope conductance in response to a series of voltage ramps between −90 and −40 mV measured in a cell in standard whole-cell recording mode. Different GABA concentrations were applied as indicated. B, mean slope conductance of five ramps at each GABA concentration was calculated and the mean of the control conductances measured before and after each test application was subtracted. Data were normalized to the 10 mm GABA response, measured on the same patch. The number of cells is indicated next to the data points. Data were fitted with a Hill equation, with an EC50 of 0.06 mm, and a Hill coefficient of 0.8.
Figure 5
Figure 5. Intracellular Ca2+ responses to glycine and GABA
A, intracellular [Ca2+] was monitored as the ratio of fluorescence at 340 and 380 nm in fura-2-loaded GLUTag cells. Glycine (0.1 mm), GABA (1 mm), strychnine (10 μm) and picrotoxin (100 μm) were added as indicated by the horizontal bars. B, mean peak fluorescence ratio (averaged over 5 s) of cells recorded as in A. Bars indicate the mean response to glycine or GABA before addition of the toxin, in the presence of toxin, and following toxin washout. The dashed line represents the background fluorescence ratio in the absence of test agent, and the numbers of cells measured are indicated above the bars. Statistical significance was tested by comparing the ratio in the presence of the toxin with the mean of the responses before and after the toxin application, using Student's paired t test; ***P < 0.001.
Figure 6
Figure 6. Pharmacological characterization of the GABA-triggered Ca2+ responses
Intracellular [Ca2+] was monitored as the ratio of fluorescence at 340 and 380 nm in fura-2-loaded GLUTag cells. A, top, responses to GABA (100 μm) in the absence and presence of bicuculline methiodide (100 μm) and (1,2,5,6-tetrahydropyridine-4-yl)methylphosphinic acid (TPMPA) (100 μm), as indicated by the horizontal bars; bottom, mean change in the fluorescence ratio (averaged over 150 s) of cells recorded as above during the application of GABA before addition and after washout of the antagonist or in the presence of the antagonist. The numbers of cells measured (in three independent experiments each) are indicated above the bars. Statistical significance was tested by comparing the ratio change in the presence of the antagonist with the mean of the responses before and after the antagonist application, using Student's paired t test; ***P < 0.001. B, top, responses to cis-4-aminocrotonic acid (CACA) (100 μm) and GABA (100 μm) applied as indicated by the horizontal bars in an example cell; bottom, mean change in the fluorescence ratio (averaged over 150 s) of cells recorded as above. The numbers of cells measured (in five independent experiments) are indicated above the bars. Statistical significance was tested by comparing the ratio changes triggered by CACA and GABA in the same cell, using Student's paired t test; ***P < 0.001.
Figure 7
Figure 7. Expression of glycine and GABA receptor subunits
A, RT-PCR detected GABA receptor α1, α2, α3, α4 and α5 and glycine receptor α2 and α3 expression in the GLUTag cell line, but not GABA receptor α6 and glycine receptor α1. Expression of all α subunits was detectable when whole mouse brain RNA was used as a template (right-hand side) and no bands were detectable when H2O was used as a template (not shown). Predicted band sizes are as indicated. The marker in the centre lane of the gel has a band every 100 bp from 200 to 1000 bp. B, nested RT-PCR detected GABA receptor ρ1, ρ2 and ρ3 subunit expression in the GLUTag cell line, and ρ1 and ρ2 subunit in mouse brain. Predicted band sizes are as indicated. The marker in the centre lane of the gel has a band every 100 bp from 200 to 1000 bp.
Figure 8
Figure 8. GLP-1 secretion triggered by glycine and GABA receptor agonists
A, GLP-1 secretion from GLUTag cells incubated for 2 h in standard bath solution containing glycine, alanine, serine, GABA or CACA at the concentrations indicated, either alone or in combination. Secretion was normalized to the baseline release in the absence of nutrients measured in parallel on the same day (mean baseline secretion 16 ± 1 fmol per well per 2 h). The number of wells is indicated above each bar. Statistical significance was tested by single-sample t test: **P < 0.01, ***P < 0.001. B, inhibition of amino acid triggered GLP-1 release by strychnine (10 μm) or picrotoxin (100 μm). GLP-1 released by addition of amino acid plus toxin is expressed relative to that released by the corresponding amino acid alone, applied in parallel on the same day. The number of wells is indicated above each bar. Statistical significance was tested by single sample t test; *P < 0.05, ***P < 0.001; n.s., not significant.
Figure 9
Figure 9. Effect of diuretics on glycine-triggered GLP-1 release
GLUTag cells were cultured overnight with bendrofluazide (50 μm), bumetanide (10 μm) or no diuretic added to the standard culture medium. GLP-1 secretion was measured the following day in response to a 2 h incubation period in standard bath solution containing the same diuretic (or no diuretic) and either glucose (Gluc, 10 mm), glycine (Gly, 1 mm), glycine plus strychnine (Gly + St, 1 mm and 10 μm), or no additions (Con) (n = 4 for each). Secretion was normalized to the baseline release in the absence of nutrients and diuretics measured in parallel on the same day. Statistical significance was tested firstly by ANOVA, and subsequently by Student's unpaired t test, if appropriate; **P < 0.01; n.s., not significant.

Similar articles

Cited by

References

    1. Bormann J, Hamill OP, Sakmann B. Mechanism of anion permeation through channels gated by glycine and gamma-aminobutyric acid in mouse cultured spinal neurones. J Physiol. 1987;385:243–286. - PMC - PubMed
    1. Brubaker PL, Drucker DJ. Glucagon-like peptides regulate cell proliferation and apoptosis in the pancreas, gut, and central nervous system. Endocrinology. 2004;145:2653–2265. - PubMed
    1. Brubaker PL, Schloos J, Drucker DJ. Regulation of glucagon-like peptide-1 synthesis and secretion in the GLUTag enteroendocrine cell line. Endocrinology. 1998;139:4108–4114. - PubMed
    1. Chebib M. GABAC receptor ion channels. Clin Exp Pharmacol Physiol. 2004;31:800–804. - PubMed
    1. Christie GR, Ford D, Howard A, Clark MA, Hirst BH. Glycine supply to human enterocytes mediated by high-affinity basolateral GLYT1. Gastroenterology. 2001;120:439–448. - PubMed

Publication types

MeSH terms

LinkOut - more resources