Comparative Study
. 2005 Dec 15;569(Pt 3):773-88.
doi: 10.1113/jphysiol.2005.096545. Epub 2005 Oct 13.

A comparison of release kinetics and glutamate receptor properties in shaping rod-cone differences in EPSC kinetics in the salamander retina

Affiliations
Comparative Study

A comparison of release kinetics and glutamate receptor properties in shaping rod-cone differences in EPSC kinetics in the salamander retina

Lucia Cadetti et al. J Physiol. .

Abstract

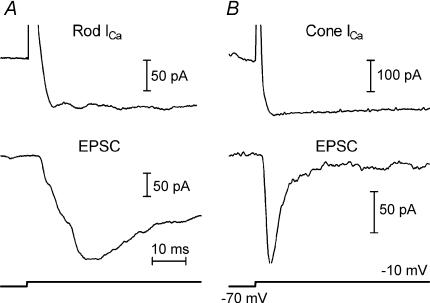
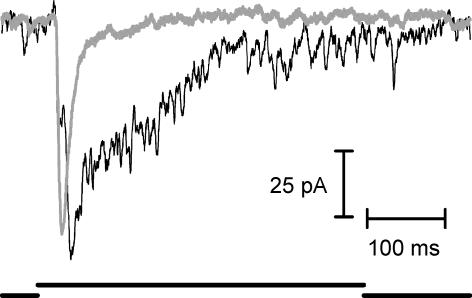
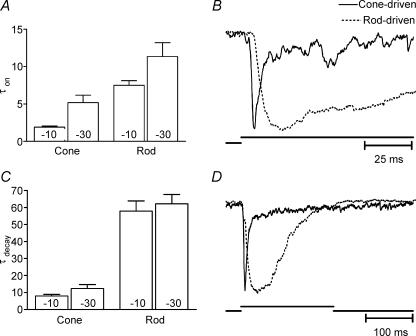
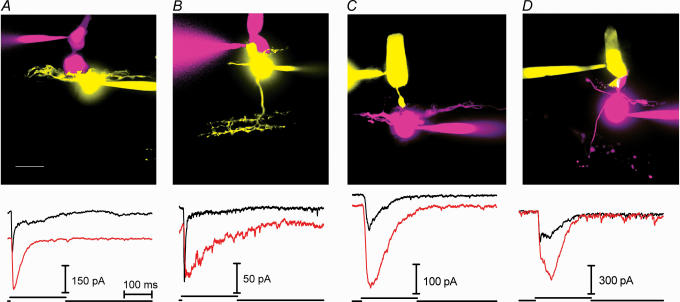
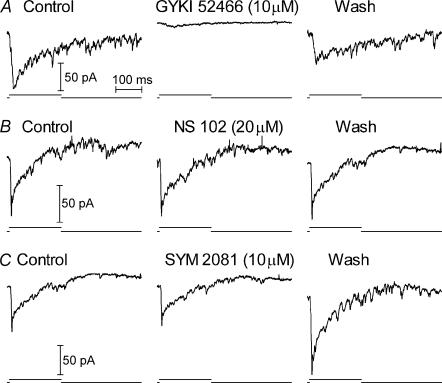
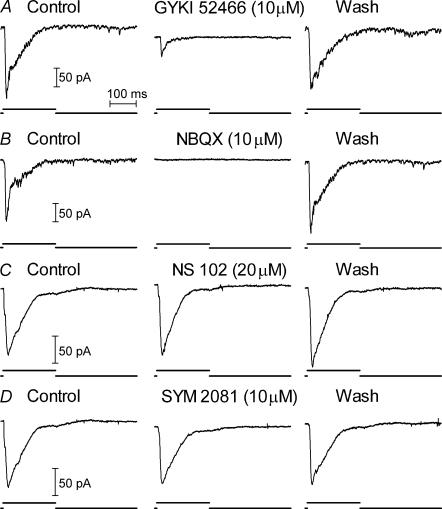
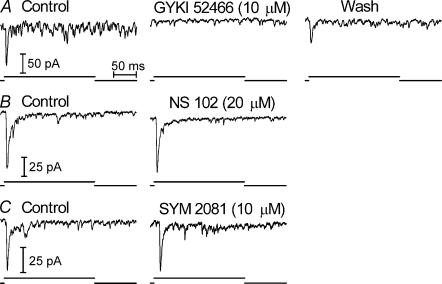
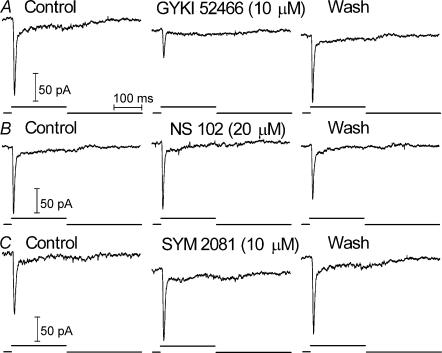
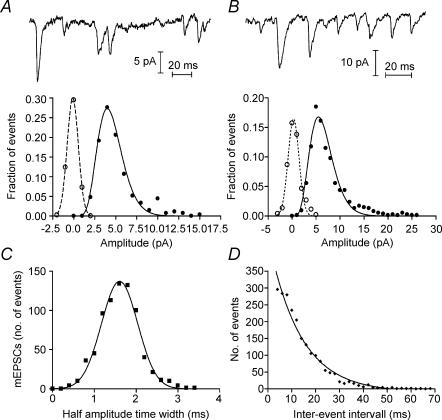
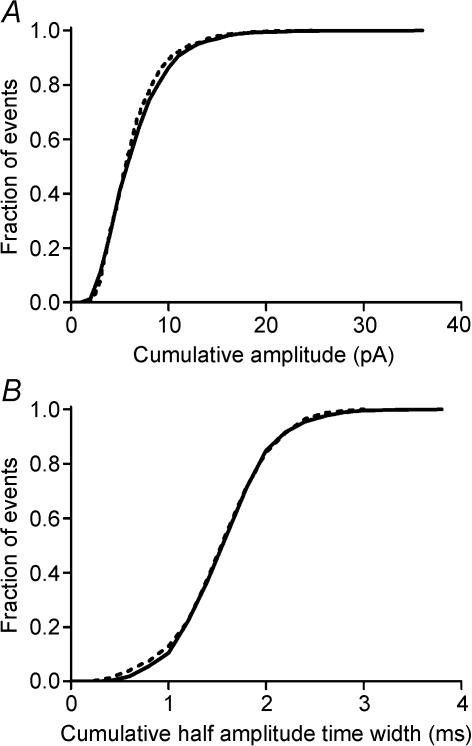
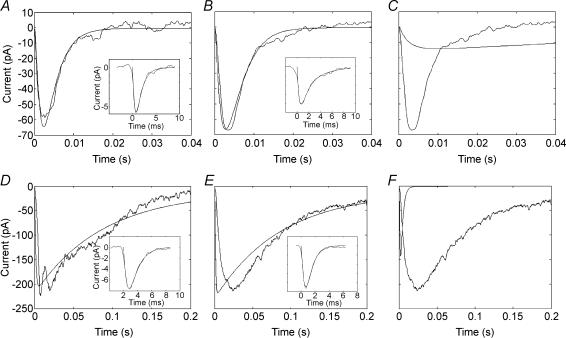
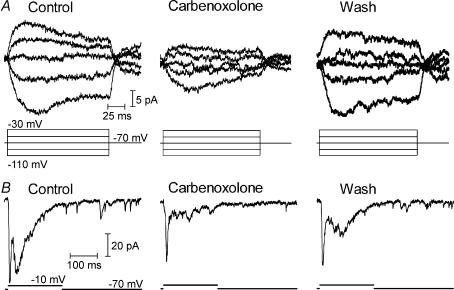
Synaptic transmission from cones is faster than transmission from rods. Using paired simultaneous recordings from photoreceptors and second-order neurones in the salamander retina, we studied the contributions of rod-cone differences in glutamate receptor properties and synaptic release rates to shaping postsynaptic responses. Depolarizing steps evoked sustained calcium currents in rods and cones that in turn produced transient excitatory postsynaptic currents (EPSCs) in horizontal and OFF bipolar cells. Cone-driven EPSCs rose and decayed faster than rod-driven EPSCs, even when comparing inputs from a rod and cone onto the same postsynaptic neurone. Thus, rod-cone differences in EPSCs reflect properties of individual rod and cone synapses. Experiments with selective AMPA and KA agonists and antagonists showed that rods and cones both contact pharmacologically similar AMPA receptors. Spontaneous miniature EPSCs (mEPSCs) exhibited unimodal distributions of amplitude and half-amplitude time width and there were no rod-cone differences in mEPSC properties. To examine how release kinetics shape the EPSC, we convolved mEPSC waveforms with empirically determined release rate functions for rods and cones. The predicted EPSC waveform closely matched the actual EPSC evoked by cones, supporting a quantal release model at the photoreceptor synapse. Convolution with the rod release function also produced a good match in rod-driven cells, although the actual EPSC was often somewhat slower than the predicted EPSC, a discrepancy partly explained by rod-rod coupling. Rod-cone differences in the rates of exocytosis are thus a major factor in producing faster cone-driven responses in second-order retinal neurones.


Figures

Figure 1
Figure 1. Depolarizing steps evoked sustained ICa in rods and cones which in turn stimulated transient EPSCs in two horizontal cells
A, top: ICa evoked by a depolarizing step from −70 to −10 mV applied to a rod. Bottom: EPSC recorded simultaneously in a horizontal cell (Vh=−40 mV). B, top: ICa evoked by a depolarizing step from −70 to −10 mV applied to a cone. Bottom: EPSC recorded simultaneously in a horizontal cell (Vh=−40 mV).
Figure 2
Figure 2. Cone inputs produce EPSCs that are faster and more transient than rod inputs into the same cell
Traces illustrate EPSCs evoked by 200 ms steps from −70 to −10 mV during simultaneous paired recording from a cone and OFF bipolar cell (grey trace) as well as a rod and the same OFF bipolar cell (black trace). Unless otherwise stated, the same stimulation protocol was used for EPSCs shown in other figures.
Figure 3
Figure 3. Onset and decay kinetics of cone-driven EPSCs are faster than those of rod-driven EPSCs
A, time constants for onset of EPSCs evoked by 200 ms steps to −10 or −30 mV in either rods or cones. B, overlay of cone-driven and rod-driven EPSCs from two different OFF bipolar cells illustrating typical rod–cone differences in rise time kinetics. C, time constants for decay of EPSCs evoked by 200 ms steps to −10 or −30 mV in either rods or cones. D, overlay of cone-driven and rod-driven EPSCs from two different horizontal cells illustrating typical rod–cone differences in decay kinetics. Cone-driven cells, steps to −10 mV, τon= 1.91 ± 0.15 ms, n = 58, τdecay= 7.97 ± 0.97 ms, n = 52. Rod-driven cells, steps to −10 mV, τon= 7.51 ± 0.62 ms, n = 38, τdecay= 57.88 ± 5.94 ms, n = 32. Cone-driven cells, steps to −30 mV, τon= 5.19 ± 1.00 ms, n = 19, τdecay= 12.28 ± 2.46 ms, n = 14. Rod-driven cells, steps to −30 mV, τon= 11.37 ± 1.85 ms, n = 15, τdecay= 62.15 ± 5.52 ms, n = 13. Rod–cone difference in τon and τdecay for steps to −10 mV: P < 0.0001. Rod–cone difference in τon for steps to −30 mV: P = 0.004. Rod–cone difference in τdecay for steps to −30 mV: P < 0.0001. Comparison of EPSC kinetics with steps to −10 and −30 mV: cones: difference in τon, P < 0.0001, difference in τdecay,P = 0.061; rods: difference in τon, P = 0.014, difference in τdecay,P = 0.67.
Figure 4
Figure 4. Cyclothiazide (100 μM) slowed the decay of EPSCs evoked in horizontal and OFF bipolar cells by stimulation of rods or cones
A, cone–horizontal cell pairs. Top: merged confocal images of a cone stained with AlexaFluor 568 and horizontal cell stained with Lucifer Yellow. Bottom: overlay of EPSCs evoked in a horizontal cell by depolarizing pulses (−70 to −10 mV) applied to a cone before (black trace) and during application of cyclothiazide (red trace). The downward offset of the cyclothiazide-treated EPSC is due to an increase in inward holding current produced by cyclothiazide in this cell (as well as those in B and C). B, cone–OFF bipolar cell pairs. Top: cone stained with AlexaFluor 568 and OFF bipolar cell stained with Lucifer Yellow. Bottom: overlay of EPSCs evoked in control conditions (black trace) and in the presence of cyclothiazide (red trace). C, rod–horizontal cell pairs. Top: rod stained with Oregon Green 6F and horizontal cell stained with AlexaFluor 568. Bottom: overlay of EPSCs evoked in control conditions (black trace) and in the presence of cyclothiazide (red trace). D, rod–OFF bipolar cell pairs. Top: rod stained with Oregon Green 6F and OFF bipolar cell stained with AlexaFluor 568. Bottom: overlay of EPSCs evoked in control conditions (black trace) and in the presence of cyclothiazide (red trace). Scale bar, 10 μm.
Figure 5
Figure 5. Rod-driven EPSCs in OFF bipolar cells were inhibited by the AMPA antagonist GYKI 52466 (10 μM) but not the KA antagonist, NS 102 (20 μM), or the KA agonist, SYM 2081 (10 μM)
Recordings in B and C are from the same cell.
Figure 6
Figure 6. Rod-driven EPSCs in horizontal cells were inhibited by the AMPA antagonists GYKI 52466 (10 μM) and NBQX (10 μM) but not the KA antagonist, NS 102 (20 μM), or the KA agonist, SYM 2081 (10 μM)
Recordings in A and B were from the same cell; recordings in C and D were from a different cell.
Figure 7
Figure 7. Cone-driven EPSCs in OFF bipolar cells were inhibited by the AMPA antagonist GYKI 52466 (10 μM) but not the KA antagonist, NS 102 (20 μM), or the KA agonist, SYM 2081 (10 μM)
Cells were lost before washout was achieved after application of NS 102 or SYM 2081. Recordings illustrated in the figure were from three different cells.
Figure 8
Figure 8. Cone-driven EPSCs in a horizontal cell were inhibited by the AMPA antagonist GYKI 52466 (10 μM) but not the KA antagonist, NS 102 (20 μM), or the KA agonist, SYM 2081 (10 μM)
All recordings were from the same cell.
Figure 9
Figure 9. Properties of spontaneous mEPSCs are consistent with quantal release
A, spontaneous mEPSCs from an OFF bipolar cell (Vh=−50 mV) and amplitude histogram of mEPSC amplitudes from the same cell (•, 272 events). The normalized mEPSC amplitude histogram was fitted with a gamma distribution (f(x) =x(α−1)e(−x/β)αΓ(α) where α= 8.61 and β= 0.52). A gamma distribution matches the skewed amplitude distribution better than a Gaussian function. The baseline noise histogram (○) was normalized to the amplitude of the event histogram and fitted with a single Gaussian curve (s.d.= 0.66 pA). B, spontaneous mEPSCs and amplitude histogram (•, 757 events) from a different OFF bipolar cell when Vh=−90 mV. The normalized mEPSC amplitude histogram was fitted with a gamma distribution (α= 6.51, β= 1.00) and baseline noise histogram (○) was fitted with a single Gaussian curve (s.d.= 1.13 pA). C, half-amplitude time width histogram of mEPSCs from the cell in B fitted with a single Gaussian curve. Mean ±s.d. = 1.61 ± 0.43 ms. D, inter-event interval histogram was fitted with a single exponential (τ= 13.5 ms), consistent with a Poisson release process.
Figure 10
Figure 10. Amplitude and kinetic properties of mEPSCs are not altered by shifting from rod-dominated (scotopic) to cone-dominated (photopic) conditions
A, normalized cumulative amplitude histograms of mEPSCs obtained from a horizontal cell in scotopic conditions (continuous line, 1983 events) and in the presence of an adapting background light (dashed line, 824 events) that suppresses output from rods (480 nm, 1.0 × 10³ photons s−1μm−2; Thoreson et al. 2003). B, normalized cumulative histograms of mEPSC half-amplitude time widths in dark-adapted conditions (continuous line) and in the presence of the background light (dashed line).
Figure 11
Figure 11. Convolutions of mEPSCs with photoreceptor release functions
A, EPSC in an OFF bipolar cell evoked by stimulation of a cone (noisy trace) is overlaid on the waveform predicted by convolution of the mEPSC with the cone release function (smooth trace). The mEPSC (inset) was averaged from 40 individual mEPSCs aligned at the half-maximal points of their rising phases and fitted with a three exponential function as described in Methods. B, average cone-driven EPSC (noisy trace) is overlaid on the waveform predicted by convolutiof the average mEPSC with the cone release function (smooth trace). The EPSC and mEPSC were both averaged from 7 cell pairs (4 cone–OFF bipolar cell pairs, 3 cone–horizontal cell pairs). To average EPSCs and mEPSCs from multiple cells, the EPSCs and average mEPSCs from each cell were normalized to 100% before the final averaging. C, for comparison purposes, the average cone-driven EPSC is overlaid on the waveform predicted by convolution of the average mEPSC with the rod release function (smooth trace). D, EPSC in a horizontal cell evoked by stimulation of a rod (noisy trace) is overlaid on the waveform predicted by convolution of the mEPSC with the rod release function (smooth trace). The mEPSC (inset) was averaged from 15 individual mEPSCs aligned at the half-maximal points of their rising phases and fitted with a three exponential function. Note the fivefold slower time base in panels D–F compared with panels A–C. E, average rod-driven EPSC (noisy trace) is overlaid on the waveform predicted by convolution of the average mEPSC with the rod release function (smooth trace). The EPSC and mEPSC were averaged from 9 cell pairs (4 rod–OFF bipolar cell pairs, 5 rod–horizontal cell pairs). F, for comparison purposes, the average rod-driven EPSC is overlaid on the waveform predicted by convolution of the average mEPSC with the cone release function (smooth trace).
Figure 12
Figure 12. Rod–rod coupling contributes preferentially to later components of the EPSC
A, carbenoxolone (0.2 mm) reversibly reduced the junctional conductance between neighbouring rods. Traces at the top show currents produced in one rod by a series of voltage steps (−110 to −30 mV) applied to the other rod. B, carbenoxolone (0.2 mm) inhibited the EPSC evoked in an OFF bipolar cell by a depolarizing step from −70 to −10 mV applied to a presynaptic rod. Note the particular reduction in the delayed component of the EPSC and partial recovery of this component after 30 min washout.

References

    1. Attwell D, Wilson M, Wu SM. A quantitative analysis of interactions between photoreceptors in the salamander (Ambystoma) retina. J Physiol. 1984;352:703–737. - PMC - PubMed
    1. Auger C, Marty A. Quantal currents at single-site central synapses. J Physiol. 2000;526:3–11. - PMC - PubMed
    1. Baylor DA, Fettiplace R. Transmission from photoreceptors to ganglion cells in turtle retina. J Physiol. 1977;271:391–448. - PMC - PubMed
    1. Baylor DA, Hodgkin AL. Detection and resolution of visual stimuli by turtle photoreceptors. J Physiol. 1973;234:163–198. - PMC - PubMed
    1. Bellingham MC, Walmsley B. A novel presynaptic inhibitory mechanism underlies paired pulse depression at a fast central synapse. Neuron. 1999;23:159–170. - PubMed

Publication types

MeSH terms