. 2005 Nov;115(11):3193-204.
doi: 10.1172/JCI24895. Epub 2005 Oct 13.

Protein phosphatase 2A is a negative regulator of IL-2 production in patients with systemic lupus erythematosus

Affiliations

Protein phosphatase 2A is a negative regulator of IL-2 production in patients with systemic lupus erythematosus

Christina G Katsiari et al. J Clin Invest. 2005 Nov.

Abstract

Decreased IL-2 production in systemic lupus erythematosus (SLE) represents a central component of the disease immunopathology. We report that the message, protein, and enzymatic activity of the catalytic subunit of protein phosphatase 2A (PP2Ac), but not PP1, are increased in patients with SLE regardless of disease activity and treatment and in a disease-specific manner. Treatment of SLE T cells with PP2Ac-siRNA decreased the protein levels and activity of PP2Ac in a specific manner and increased the levels of phosphorylated cAMP response element-binding protein and its binding to the IL2 and c-fos promoters, as well as increased activator protein 1 activity, causing normalization of IL-2 production. Our data document increased activity of PP2A as a novel SLE disease-specific abnormality and define a distinct mechanism whereby it represses IL-2 production. We propose the use of PP2Ac-siRNA as a novel tool to correct T cell IL-2 production in SLE patients.


Figures

Figure 1
Figure 1
PP2Ac protein levels are increased in SLE T cells. Cellular protein extracts of T cells derived from patients with SLE (L) and normal (N) subjects were examined in parallel for the expression of PP2Ac using Western blots. (A) Immunoblots from a representative experiment are shown. β-Actin was used as control. (B) Scatter diagram showing cumulative data from 30 patients with SLE and 25 normal subjects. Results for active (SLEDAI, 4–14) and inactive (SLEDAI, 0–3) patients are depicted separately. The intensity of the bands was measured by densitometry, and the PP2Ac/β-actin ratio was calculated. All measurements are depicted as well as the mean value for each study group ± SEM. P values derived from statistical analysis (2-tailed unpaired t test with Welch correction) are also shown.
Figure 2
Figure 2
SLE T cells express increased levels of PP2A but not PP1. Western blot analysis was used for the parallel study of PP2Ac and PP1 expression in T cells from patients with SLE and normal subjects. (A) Immunoblots depicting PP2Ac, PP1, and β-actin from a representative experiment. (B) Diagram presenting cumulative data from the study of 16 patients with SLE and 13 normal subjects. The intensity of the bands was measured by densitometry. The levels of PP1 are expressed as the PP1/β-actin ratio.
Figure 3
Figure 3
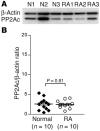
T cells from patients with RA do not express increased levels of PP2Ac protein. Western blot analysis of PP2Ac expression in normal subjects and patients with RA. (A) Results from a representative experiment are shown with simultaneous immunoblotting for PP2Ac and β-actin. (B) Cumulative data from 10 RA patients and 10 normal subjects are presented. PP2Ac expression was determined as described for Figure 1.
Figure 4
Figure 4
PP2Ac enzymatic activity is increased in SLE T cells. PP2Ac enzymatic activity was studied in peripheral blood T cells from patients with SLE or RA and normal subjects as described in Methods and is presented as picomoles PO43–/microgram of protein. PP2Ac protein levels were studied in parallel using Western blots. (A) Cumulative data of PP2Ac catalytic activity are presented. Statistical significance is also shown. (B) Results from a representative experiment are shown where PP2Ac enzymatic activity (upper panel: malachite green assay; phosphatase activity values [pmol PO43–/μg protein, mean ± SEM of triplicates] corresponding to each sample are noted below the panel) was assessed in parallel with PP2Ac protein levels (lower panel; PP2Ac/β-actin ratios are noted below the panel). Anti-IgG immunoprecipitates and β-actin protein levels were used as controls for the determination of the activity and the expression of PP2Ac, respectively. (C) Experiments performed to assess nonspecific results due to contamination with residual PO43– or with nonspecific immunoprecipitates. Enzymatic activity of anti-PP2Ac immunocomplexes was abolished in the presence of the Ser/Thr phosphatase inhibitor NaF (upper panel, representative of 6 experiments). Western blot analysis of the anti-PP2Ac immunoprecipitates detected only PP2Ac protein, whereas when the control anti-IgG Ab was used, no protein was precipitated (lower panel). (D) PP2Ac activity is increased in SLE T cells from patients with active and inactive disease, regardless of prednisone treatment. Results for patients receiving no, low dose (≤7.5 mg/d), or moderate dose (>7.5 to <40 mg/d) of prednisone as well as active (SLEDAI, 4–14) and inactive (SLEDAI, 0–3) patients are depicted separately.
Figure 5
Figure 5
PP2Ac mRNA is increased in lupus T cells and correlates with PP2Ac protein levels. T cell PP2Ac mRNA levels were assessed using real-time RT-PCR as described in Methods. PP2Ac protein levels were determined by Western blotting. (A) Results from a representative experiment with 1 SLE (L1) patient and 1 normal subject (N1) studied in parallel. PP2Ac (upper panel) and β-actin (lower panel) mRNA levels were assessed simultaneously (PP2Ac mRNA, L1 threshold cycle [Ct]: 24.34, N1 Ct: 26.88; β-actin mRNA, L1 Ct: 26.25, N1 Ct: 26.07). (B) Cumulative data of PP2Ac-mRNA levels from 12 normal subjects and 19 patients with SLE. All values are depicted as well as the mean value ± SEM. (C) Levels of PP2Ac mRNA are plotted against PP2Ac protein levels. Results from linear regression analysis are also shown.
Figure 6
Figure 6
Downregulation of PP2Ac expression using RNA interference. Primary T cells were transfected with siRNAs that target PP2Ac. Protein levels of PP2Ac, assessed with Western blots, were examined in time- and dose-response experiments. Cells were also transfected with an irrelevant nonsilencing siRNA to control for nonspecific effects. (A) Representative experiment showing the effect of different doses of PP2Ac-siRNA on PP2Ac protein levels in normal T cells cultured for 30 hours. (B) Time/dose-response curves of PP2Ac downregulation following transfection with PP2Ac-siRNA. (C) Expression of PP2Ac in T cells transfected with either PP2Ac-siRNA or control siRNA. Results from a representative experiment are shown. (D) Cumulative data from 5 independent experiments showing the degree of PP2Ac downregulation following PP2Ac-siRNA and as compared with cells that were either untreated or transfected with control siRNA. *P = 0.05 when compared with PP2Ac-siRNA–treated T cells.
Figure 7
Figure 7
Suppression of PP2Ac in SLE T cells enhances pCREB expression and pCREB binding to the IL2 promoter. T cells from patients with SLE were transfected with either PP2Ac- or control siRNA. Following 30 hours of culture, cells were stimulated for 1–2 hours with PMA/A23187. (A) Western blot analysis of pCREB and PP2Ac expression in nuclear and total cellular protein extracts, respectively. Heterogeneous ribonucleoprotein (hnRNP) and β-actin were used as controls (pCREB/hnRNP and PP2Ac/β-actin ratios are noted below the corresponding panels). Results from a representative of 5 similar experiments are shown. (B) ChIP assay performed as described in Methods. Anti-pCREB–immunoprecipitated DNA, derived from cells manipulated as described above, were subjected to PCR using primers specific for the –180 binding site of the IL2 promoter (OD values corresponding to each sample are noted below the panel). Results from a representative of 3 similar experiments are shown.
Figure 8
Figure 8
Downregulation of PP2Ac restores IL-2 production and IL2 promoter activity in SLE T cells. (A) T cells were transfected with either PP2Ac- or control siRNA. Cells were then stimulated with PMA/A23187 for 3 hours. IL-2 was measured as described in Methods. *P = 0.03 and 0.05 when compared with nontransfected normal T cells and with transfected lupus T cells, respectively; **P = 0.05 compared with nontransfected normal T cells. (B) PP2Ac-siRNA treatment downregulates PP2Ac but not PP2Aa expression. Results from 2 independent experiments with normal T cells are shown (PP2Ac/PP2Aa ratios are noted below the panels). (C) T cells were treated as indicated, and IL-2 was measured. Results from 1 of 2 similar experiments are shown. (D) T cells were transfected with plasmids encoding either the wild-type PP2Ac or DN PP2Ac mutants (H118N or L199P). Twenty hours following transfection, cells were stimulated with PMA/A23187 for 6 hours. P values represent the result of paired t test analysis. (E) Results from the same experiment as shown in D, except that T cells were stimulated with OKT3/anti-CD3 mAbs for 18 hours. (F) T cells were cotransfected with (a) a plasmid encoding an IL2 promoter luciferase construct or an empty vector, (b) a β-galactosidase plasmid, and (c) either PP2Ac- or control siRNA. Following 24 hours of culture, cells were stimulated for 1 hour with PMA/A23187. IL2 promoter activity was assessed as the luciferase activity. Numbers show the fold increase in IL2 promoter activity when compared with stimulated cells in the absence of PP2Ac-siRNA. Results from 1 of 2 similar experiments are presented.
Figure 9
Figure 9
PP2Ac-siRNA increases AP1 activity in SLE T cells by increasing the binding of pCREB to the c-fos promoter. (A and B) PP2Ac-siRNA increases AP1 activity in SLE T cells. An AP1 binding [32P]-radiolabeled oligonucleotide was used in EMSA, where AP1 binding activity was assessed in nuclear extracts derived from cells that were transfected in the presence or absence of PP2Ac-siRNA and subsequently stimulated for 2 hours. Results from a representative experiment with 1 SLE patient and 1 normal subject are shown (A). (B) Mean ± SEM of AP1 binding from 3 patients with SLE and 3 normal subjects examined in parallel are displayed. AP1 binding was quantitated by densitometry of autoradiographed bands. P values are also shown. (C and D) PP2Ac-siRNA–mediated pCREB upregulation parallels increased binding of pCREB to the c-fos promoter and increased binding of both pCREB and c-fos to the IL2 promoter. Normal T cells were transfected with either PP2Ac- or control siRNA and then stimulated with PMA/A23187 for 1–3 hours. pCREB expression was assessed with Western blots (C), and in vivo DNA binding of pCREB and c-fos was examined using ChIP assays (D) as described in Methods. Anti-E47 immunoprecipitates were used as negative control. Results from a representative of 3 similar experiments are shown. (E) T cells were transfected with wild-type PP2Ac or H118N and then stimulated with PMA/A23187 for 1 hour. DNA binding of pCREB and c-fos to the IL2 promoter was examined with ChIP assays (OD values corresponding to each sample are noted below the panel). Results from 1 of 2 similar experiments is shown.

Similar articles

Cited by

References

    1. Linker-Israeli M, et al. Defective production of interleukin 1 and interleukin 2 in patients with systemic lupus erythematosus (SLE) J. Immunol. 1983;130:2651–2655. - PubMed
    1. Theofilopoulos AN, Dixon FJ. Murine models of systemic lupus erythematosus. Adv. Immunol. 1985;37:269–390. - PubMed
    1. Nelson BH. IL-2, regulatory T cells, and tolerance. J. Immunol. 2004;172:3983–3988. - PubMed
    1. Iliopoulos AG, Tsokos GC. Immunopathogenesis and spectrum of infections in systemic lupus erythematosus. Semin. Arthritis Rheum. 1996;25:318–336. - PubMed
    1. Kovacs B, Vassilopoulos D, Vogelgesang SA, Tsokos GC. Defective CD3-mediated cell death in activated T cells from patients with systemic lupus erythematosus: role of decreased intracellular TNF-alpha. Clin. Immunol. Immunopathol. 1996;81:293–302. - PubMed

Publication types

MeSH terms