. 2005 Nov;115(11):3015-25.
doi: 10.1172/JCI24862. Epub 2005 Oct 13.

A cancer-specific transcriptional signature in human neoplasia

Affiliations

A cancer-specific transcriptional signature in human neoplasia

Francesco Nicassio et al. J Clin Invest. 2005 Nov.

Abstract

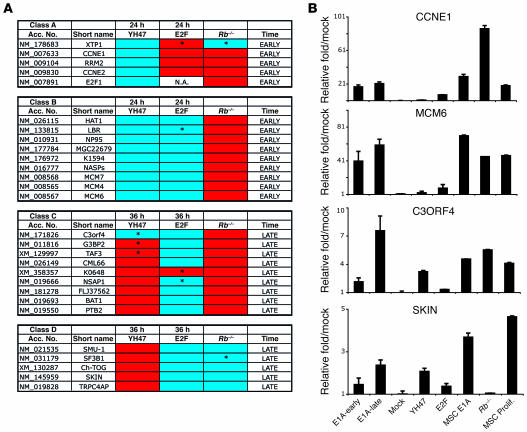
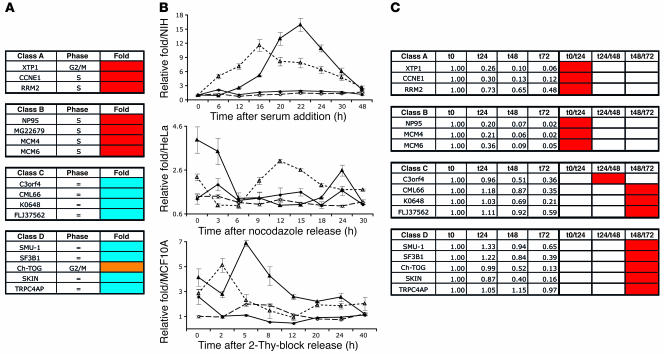
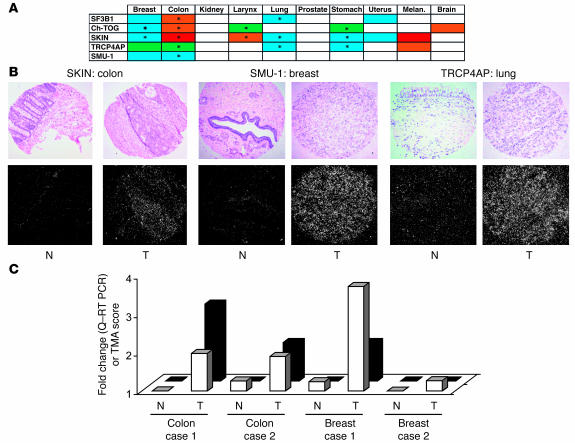
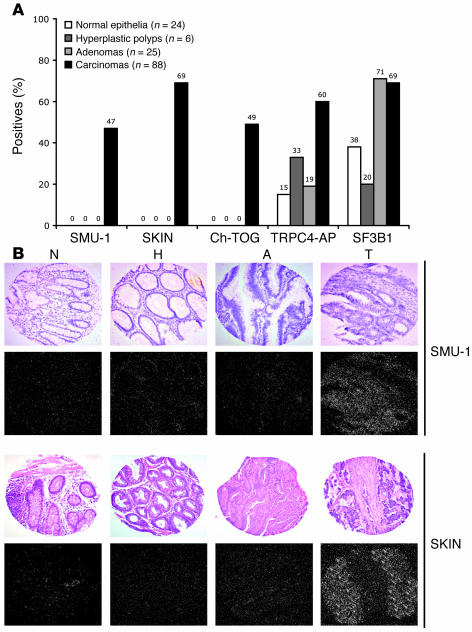
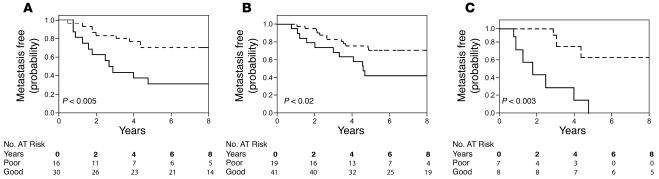
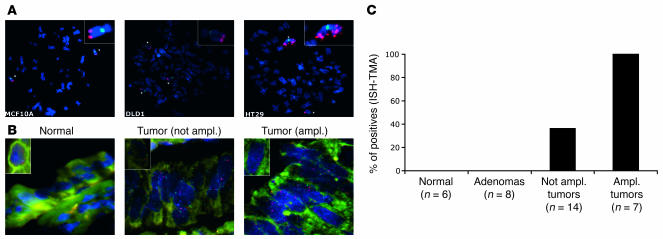
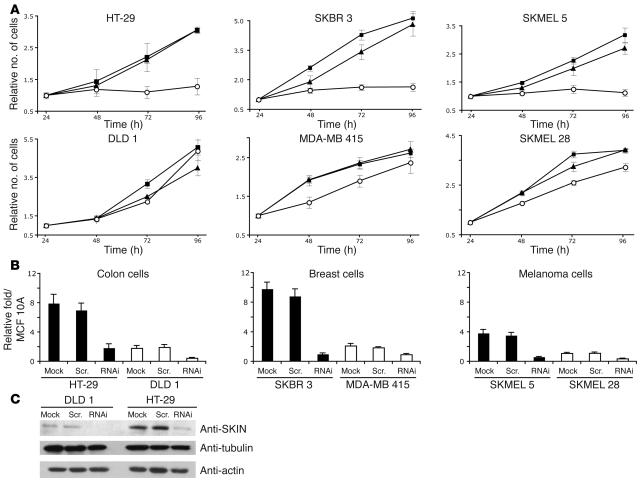
The molecular anatomy of cancer cells is being explored through unbiased approaches aimed at the identification of cancer-specific transcriptional signatures. An alternative biased approach is exploitation of molecular tools capable of inducing cellular transformation. Transcriptional signatures thus identified can be readily validated in real cancers and more easily reverse-engineered into signaling pathways, given preexisting molecular knowledge. We exploited the ability of the adenovirus early region 1 A protein (E1A) oncogene to force the reentry into the cell cycle of terminally differentiated cells in order to identify and characterize genes whose expression is upregulated in this process. A subset of these genes was activated through a retinoblastoma protein/E2 viral promoter required factor-independent (pRb/E2F-independent) mechanism and was overexpressed in a fraction of human cancers. Furthermore, this overexpression correlated with tumor progression in colon cancer, and 2 of these genes predicted unfavorable prognosis in breast cancer. A proof of principle biological validation was performed on one of the genes of the signature, skeletal muscle cell reentry-induced (SKIN) gene, a previously undescribed gene. SKIN was found overexpressed in some primary tumors and tumor cell lines and was amplified in a fraction of colon adenocarcinomas. Furthermore, knockdown of SKIN caused selective growth suppression in overexpressing tumor cell lines but not in tumor lines expressing physiological levels of the transcript. Thus, SKIN is a candidate oncogene in human cancer.


Figures

Figure 1
Figure 1
E1A-induced genes and their classification. (A) The E1A-induced genes are indicated by their accession numbers (acc. no.) and short names. Q–RT-PCR analysis was performed under the following conditions: (a) overexpression of E1A (not shown here; see Supplemental Table 2); (b) overexpression of the E1A mutant YH47/dl928 (YH47); (c) overexpression of E2F1 (E2F); and (d) removal of Rb (Rb–/–). Values were normalized to those obtained upon overexpression of E1A and are expressed with a color code. YH47 and E2F conditions, red/blue, > or < 35% vs. the E1A-induced condition, respectively; Rb–/– condition, red/blue, > or < 50% vs. the E1A-induced condition, respectively. Actual values are in Supplemental Table 4, and details on each experimental condition are in Supplemental Tables 5–7. Asterisks mark nonsignificant values (P > 0.05). Early and late refer to activation by E1A (actual values are in Supplemental Table 3). (B) Examples of data reported in A. The bar graphs show transcript levels (measured by Q–RT-PCR) of representative genes, as indicated. E1A-early and -late, overexpression of E1A at early and late time points; mock, dl312 adenovirus control; YH47, overexpression of the E1A mutant YH47/dl928; E2F, overexpression of E2F1; MSC-E1A, overexpression of E1A in MSCs; Rb–/–, removal of Rb; MSC prolif., proliferating myoblasts. Values are normalized to mock-infected myotubes (assumed as 1.0). Results are from a single experiment; statistical analyses on repeated experiments are indicated in Supplemental Tables 2–7.
Figure 2
Figure 2
E1A-induced genes in cell cycle and differentiation. E1A-induced genes were analyzed during cell cycle progression and MSC-differentiation. (A) Expression levels of representative genes, analyzed by Q–RT-PCR, during cell cycle progression of NIH-3T3. The lowest value in each kinetic was assumed as 1, and other values were normalized to it. Red, cell cycle regulated genes (> 10 fold); orange, poorly cell cycle regulated genes (4–10 fold); blue, not regulated, or marginally regulated, genes (marginally regulated, 2–4 fold: C3orf4, K0648, SF3B1; not regulated, < 2 fold, CML66, FLJ37562, SMU-1, SKIN, and TRPC4AP). The cell cycle phase in which gene expression peaked is also indicated. (B) Examples of cell cycle regulation in NIH-3T3 (top), HeLa cells (middle), and MCF10A cells (bottom) of representative genes. TRPC4AP, open circles; SKIN, filled circles; XTP1, filled triangles; MGC22679, open triangles. (C) Representative genes were analyzed during differentiation of primary MSCs. MSCs were grown as proliferating myoblasts (t0) and then induced to differentiate. When committed to differentiation, myocytes undergo first an irreversible cell cycle arrest (characterized by block of DNA synthesis, p21 accumulation, and pRb hypophosphorylation) (t24), followed by phenotypic differentiation (t48) (evidenced by the accumulation of differentiation markers such as myosin heavy chain and muscle creatine kinase), and eventually by cell fusion (t72). Transcript levels were measured by Q–RT-PCR every 24 hours during differentiation and normalized to undifferentiated myoblasts (t0). Red indicates the time window in which the highest degree of regulation was detected.
Figure 3
Figure 3
Class D genes in human tumors. (A) The overexpression of class D genes was tested by ISH on TMAs. The color code indicates the percentage of tumors in which overexpression was detected (actual numbers are reported in Supplemental Table 10). White, 0–20%; blue, 21–40%; green, 41–60%; orange, 61–80%; red, 81–100%. In almost all cases (with the exception of TRPC4AP and SF3B1 in normal colon; see Figure 4), normal counterparts (not reported here) showed low or undetectable levels of expression (≤ 1 on our scale; see Methods). Asterisks mark significant values (P < 0.05) of overexpression in tumors vs. normal counterparts. In some cases (uterus, melanoma [melan.], brain), statistical analysis could not be performed due to lack of normal tissues (see Supplemental Table 10 for further details). Eight other genes (from classes A–C, LBR, XTP1, MGC22679, K1594, C3orf4, CML66, K0648, and FLJ37562) showed no overexpression (not shown). Two additional class B genes (Np95 and Nasp) showed elevated mRNA levels in both tumors and proliferating cells of the normal counterparts, thus not fulfilling the criteria for overexpression (see text). (B) Examples of data reported in A. N, normal tissue; T, tumor. Top row, bright fields (histology); bottom row, dark fields (transcripts appear as bright dots). Original magnification, ×10. (C) Tumor and normal samples from colon and breast carcinoma patients were analyzed for levels of expression of SKIN by ISH (black bars) and Q–RT-PCR (white bars), respectively. Q–RT-PCR data are normalized to colon case 1N (assumed as 1.0). Data show good correlation between the 2 methods.
Figure 4
Figure 4
Class D genes in colon cancer progression. (A) Expression of class D genes was evaluated by ISH in the indicated samples on TMAs. Data are expressed as percentage of positive samples. The absolute number of positive samples is also indicated at the top of each column. (B) Selected examples of the data shown in A. N, normal epithelium; H, hyperplastic polyp; A, adenoma; T, adenocarcinoma. Bright and dark fields are as in Figure 3. Original magnification, ×10. See also Supplemental Table 12 for statistical analysis and correlations with clinical and biological parameters.
Figure 5
Figure 5
Selected class D genes predict disease outcome in breast cancer. Two class D genes (SKIN and Ch-TOG) were used together as a predictor (see Supplemental Methods) of prognostic outcome on 2 independent data sets, one generated in-house (A), another from van’t Veer (42) (B), and finally on 15 randomly selected breast tumor patients analyzed by Q–RT-PCR (C) (see Table 1 for details). Data are shown as the probability of remaining free of metastatic relapse, in a Kaplan-Meier plot, as a function of a favorable (dashed line) or unfavorable (continuous line) signature. See also Supplemental Table 13 for details. (C) Probability of remaining metastasis free is shown in a Kaplan-Meier plot, as a function of the presence of the favorable (dashed line) or unfavorable (continuous line) signature. In AC, the P values indicated were calculated with the log-rank test.
Figure 6
Figure 6
SKIN is amplified in colon cancers. (A) Left, FISH analysis on metaphase-blocked human cell lines (MCF10A, normal epithelial cells; DLD1 and HT29, colon carcinoma cells). Red, SKIN probe (RP11-1139F3); green, subcentromeric 8q probe (RP11-1031I1); blue, DAPI. Insets: Details of the corresponding images showing FISH on chromosome 8. Original magnification, ×100. (B) FISH analysis in human colon cancer specimens of SKIN (red) and chromosome 8 (green). The average number of SKIN signals per cell was counted and normalized to the number of signals with chromosome 8 probe. Samples were considered amplified (amp.) if more than 50% of the epithelial cells presented exhibited more than 4 signals per cell. Examples are shown: normal, normal epithelium (copies/cell = 2); tumor, not amplified (copies/cell < 4); tumor, amplified (copies/cell > 4). Insets: Details of the corresponding images showing FISH on a single cell. Original magnification, ×60. (C) The bar graph shows the percentage of SKIN-overexpressing samples (evaluated by ISH) in various colon specimens.
Figure 7
Figure 7
Functional ablation of SKIN in tumor cell lines. Six different tumor cell lines (as indicated) were treated with SKIN-specific siRNA (open circles in A; RNAi in B and C) or a control scrambled oligo (filled triangles in A; scr. in B and C) or were mock treated (filled squares in A; mock in B and C). Twenty-four hours after treatment, cells were replated to measure cell growth (A) or analyzed for SKIN transcript levels by Q–RT-PCR (B). (A) Cells, replated in standard growth medium, were counted at the indicated time points. Data are expressed relative to the number of cells present in the plate 24 hours after replating (assumed as 1). (B) Q–RT-PCR data are expressed relative to those detected in growing MCF10A cells, to allow for comparison among cell lines. The mRNA levels of 2 double-stranded RNA-activated protein kinase–induced (PKR-induced) genes (STAT1 and interferon-induced transmembrane protein-IFITM1) were also analyzed to exclude nonspecific effects driven by SKIN-siRNA procedures and are reported on in Supplemental Figure 6. (C) In the case of DLD1 and HT-29 cells, levels of SKIN were also measured by Western blot with an anti-SKIN antibody. Results in A, B, and C were also replicated with a second SKIN-specific siRNA (oligo 2; see Supplemental Methods) with comparable results (not shown).

Similar articles

Cited by

References

    1. Ramaswamy S, et al. Multiclass cancer diagnosis using tumor gene expression signatures. Proc. Natl. Acad. Sci. U. S. A. 2001;98:15149–15154. - PMC - PubMed
    1. Ramaswamy S, Golub TR. DNA microarrays in clinical oncology. J. Clin. Oncol. 2002;20:1932–1941. - PubMed
    1. Iafrate AJ, et al. Detection of large-scale variation in the human genome. Nat. Genet. 2004;36:949–951. - PubMed
    1. Jones C, et al. Molecular cytogenetic identification of subgroups of grade III invasive ductal breast carcinomas with different clinical outcomes. Clin. Cancer Res. 2004;10:5988–5997. - PubMed
    1. Pollack JR, et al. Microarray analysis reveals a major direct role of DNA copy number alteration in the transcriptional program of human breast tumors. Proc. Natl. Acad. Sci. U. S. A. 2002;99:12963–12968. - PMC - PubMed

Publication types