

Distinct chemokine triggers and in vivo migratory paths of fluorescein dye-labeled T Lymphocytes in acutely simian immunodeficiency virus SIVmac251-infected and uninfected macaques
- PMID: 16227295
- PMCID: PMC1262620
- DOI: 10.1128/JVI.79.21.13759-13768.2005
Distinct chemokine triggers and in vivo migratory paths of fluorescein dye-labeled T Lymphocytes in acutely simian immunodeficiency virus SIVmac251-infected and uninfected macaques
Abstract
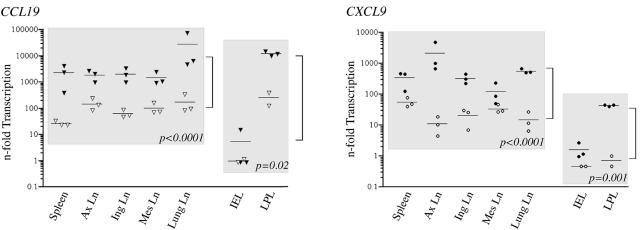
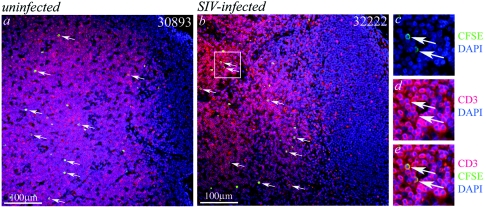
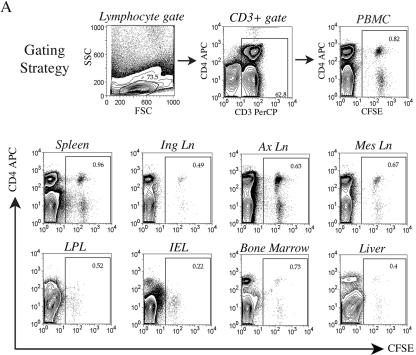
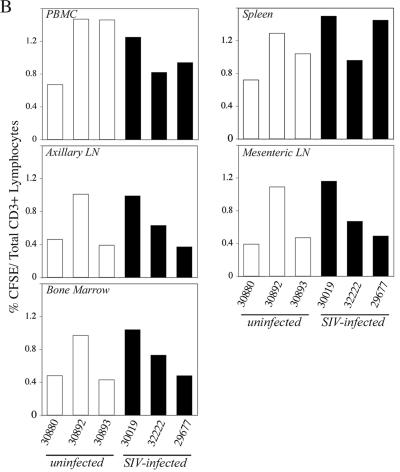
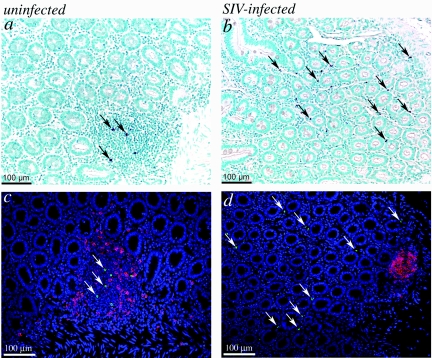
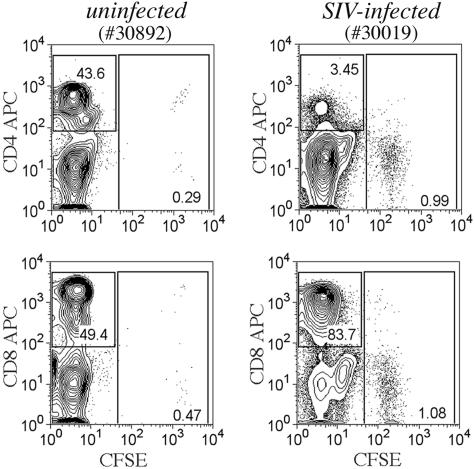
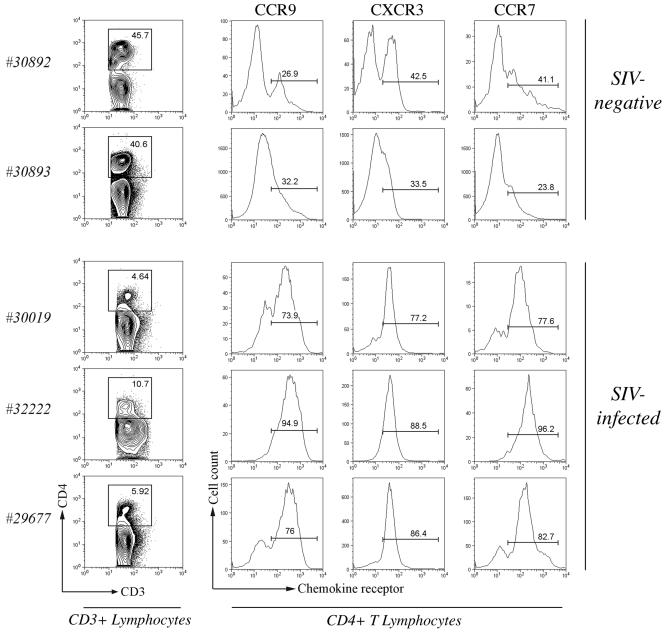
To define the possible impact of T-lymphocyte trafficking parameters on simian immunodeficiency virus (SIV) pathogenesis, we examined migratory profiles of carboxyfluorescein diacetate succinimidyl ester (CFSE)-labeled T lymphocytes in acutely SIVmac251-infected and uninfected macaques within 48 h after autologous transfer. Despite significant upregulation of homeostatic chemokine CCL19/macrophage inflammatory protein 3beta and proinflammatory chemokine CXCL9/monokine induced by gamma interferon in secondary lymphoid tissue in SIV infection, no differences in CFSE+ T-lymphocyte frequencies or cell compartmentalization in lymph nodes were identified between animal groups. By contrast, a higher frequency of CFSE+ T lymphocytes in the small intestine was detected in acute SIV infection. This result correlated with increased numbers of gut CD4 T lymphocytes expressing chemokine receptors CCR9, CCR7, and CXCR3 and high levels of their respective chemokine ligands in the small intestine. The changes in trafficking parameters in SIV-infected macaques occurred concomitantly with acute gut CD4 T-lymphocyte depletion. Here, we present the first in vivo T-lymphocyte trafficking study in SIV infection and a novel approach to delineate T-lymphocyte recruitment into tissues in the nonhuman primate animal model for AIDS. Such studies are likely to provide unique insights into T-lymphocyte sequestration in distinct tissue compartments and possible mechanisms of CD4 T-lymphocyte depletion and immune dysfunction in simian AIDS.
Figures
Similar articles
-
Increased expression of the inflammatory chemokine CXC chemokine ligand 9/monokine induced by interferon-gamma in lymphoid tissues of rhesus macaques during simian immunodeficiency virus infection and acquired immunodeficiency syndrome.Blood. 2002 May 1;99(9):3119-28. doi: 10.1182/blood.v99.9.3119. Blood. 2002. PMID: 11964273
-
Expression of IFN-gamma induced CXCR3 agonist chemokines and compartmentalization of CXCR3+ cells in the periphery and lymph nodes of rhesus macaques during simian immunodeficiency virus infection and acquired immunodeficiency syndrome.J Med Primatol. 2003 Aug;32(4-5):247-64. doi: 10.1034/j.1600-0684.2003.00031.x. J Med Primatol. 2003. PMID: 14498985
-
Simian immunodeficiency virus infection potently modulates chemokine networks and immune environments in hilar lymph nodes of cynomolgus macaques.J Acquir Immune Defic Syndr. 2013 Aug 1;63(4):428-37. doi: 10.1097/QAI.0b013e31828ac85f. J Acquir Immune Defic Syndr. 2013. PMID: 23429503 Free PMC article.
-
The Hitchhiker Guide to CD4+ T-Cell Depletion in Lentiviral Infection. A Critical Review of the Dynamics of the CD4+ T Cells in SIV and HIV Infection.Front Immunol. 2021 Jul 21;12:695674. doi: 10.3389/fimmu.2021.695674. eCollection 2021. Front Immunol. 2021. PMID: 34367156 Free PMC article.
-
The role of immunity in protection from mucosal SIV infection in macaques.Oral Dis. 2002;8 Suppl 2:63-8. doi: 10.1034/j.1601-0825.2002.00014.x. Oral Dis. 2002. PMID: 12164663 Review.
Cited by
-
Sex differences matter in the gut: effect on mucosal immune activation and inflammation.Biol Sex Differ. 2013 May 7;4(1):10. doi: 10.1186/2042-6410-4-10. Biol Sex Differ. 2013. PMID: 23651648 Free PMC article.
-
Acute Simian Immunodeficiency Virus Infection Triggers Early and Transient Interleukin-7 Production in the Gut, Leading to Enhanced Local Chemokine Expression and Intestinal Immune Cell Homing.Front Immunol. 2017 May 19;8:588. doi: 10.3389/fimmu.2017.00588. eCollection 2017. Front Immunol. 2017. PMID: 28579989 Free PMC article.
-
High-throughput proteomic analysis reveals systemic dysregulation in virally suppressed people living with HIV.JCI Insight. 2023 Jun 8;8(11):e166166. doi: 10.1172/jci.insight.166166. JCI Insight. 2023. PMID: 37079385 Free PMC article.
-
Memory T cells in Rhesus macaques.Adv Exp Med Biol. 2010;684:126-44. doi: 10.1007/978-1-4419-6451-9_10. Adv Exp Med Biol. 2010. PMID: 20795545 Free PMC article. Review.
-
Changes in chemokines and chemokine receptor expression on tonsillar B cells upon Epstein-Barr virus infection.Immunology. 2009 Aug;127(4):549-57. doi: 10.1111/j.1365-2567.2008.03029.x. Immunology. 2009. PMID: 19604305 Free PMC article.
References
-
- Alimonti, J. B., T. B. Ball, and K. R. Fowke. 2003. Mechanisms of CD4+ T lymphocyte cell death in human immunodeficiency virus infection and AIDS. J. Gen. Virol. 84:1649-1661. - PubMed
-
- Appay, V., D. F. Nixon, S. M. Donahoe, G. M. Gillespie, T. Dong, A. King, G. S. Ogg, H. M. Spiegel, C. Conlon, C. A. Spina, D. V. Havlir, D. D. Richman, A. Waters, P. Easterbrook, A. J. McMichael, and S. L. Rowland-Jones. 2000. HIV-specific CD8(+) T cells produce antiviral cytokines but are impaired in cytolytic function. J. Exp. Med. 192:63-75. - PMC - PubMed
-
- Brenchley, J. M., N. J. Karandikar, M. R. Betts, D. R. Ambrozak, B. J. Hill, L. E. Crotty, J. P. Casazza, J. Kuruppu, S. A. Migueles, M. Connors, M. Roederer, D. C. Douek, and R. A. Koup. 2003. Expression of CD57 defines replicative senescence and antigen-induced apoptotic death of CD8+ T cells. Blood 101:2711-2720. - PubMed
-
- Brenchley, J. M., T. W. Schacker, L. E. Ruff, D. A. Price, J. H. Taylor, G. J. Beilman, P. L. Nguyen, A. Khoruts, M. Larson, A. T. Haase, and D. C. Douek. 2004. CD4+ T cell depletion during all stages of HIV disease occurs predominantly in the gastrointestinal tract. J. Exp. Med. 200:749-759. - PMC - PubMed
Publication types
MeSH terms
Substances
Grants and funding
LinkOut - more resources
Full Text Sources
Research Materials
