

Tumor promotion by caspase-resistant retinoblastoma protein
- PMID: 16227443
- PMCID: PMC1255734
- DOI: 10.1073/pnas.0503925102
Tumor promotion by caspase-resistant retinoblastoma protein
Abstract
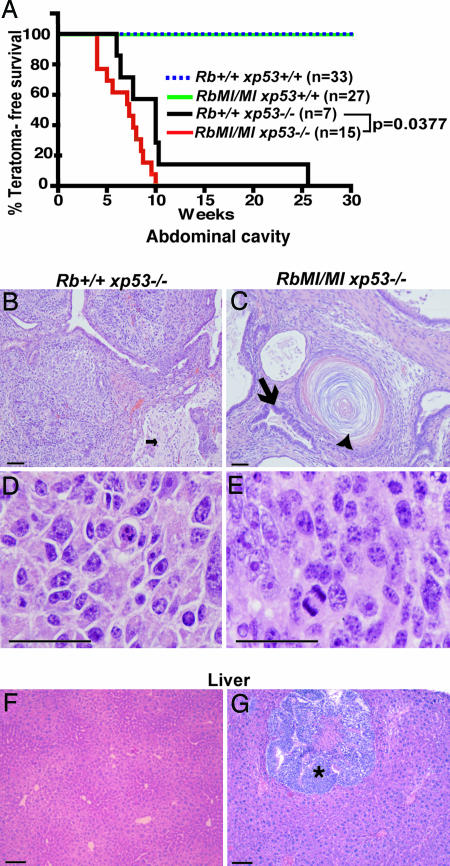
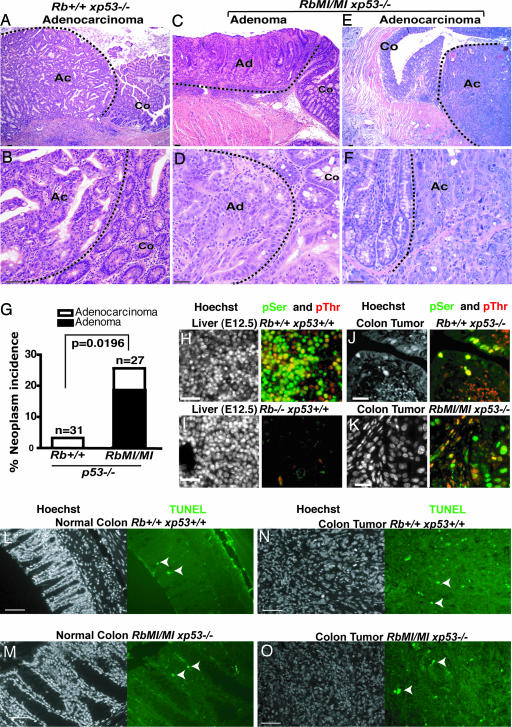
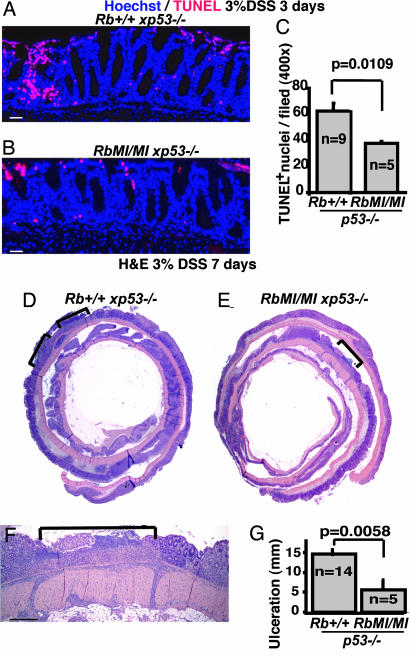
The retinoblastoma (RB) protein regulates cell proliferation and cell death. RB is cleaved by caspase during apoptosis. A mutation of the caspase-cleavage site in the RB C terminus has been made in the mouse Rb-1 locus; the resulting Rb-MI mice are resistant to endotoxin-induced apoptosis in the intestine. The Rb-MI mice do not exhibit increased tumor incidence, because the MI mutation does not disrupt the Rb tumor suppressor function. In this study, we show that Rb-MI can promote the formation of colonic adenomas in the p53-null genetic background. Consistent with this tumor phenotype, Rb-MI reduces colorectal epithelial apoptosis and ulceration caused by dextran sulfate sodium. By contrast, Rb-MI does not affect the lymphoma phenotype of p53-null mice, in keeping with its inability to protect thymocytes and splenocytes from apoptosis. The Rb-MI protein is expressed and phosphorylated in the tumors, thereby inactivating its growth suppression function. These results suggest that RB tumor suppressor function, i.e., inhibition of proliferation, is inactivated by phosphorylation, whereas RB tumor promoting function, i.e., inhibition of apoptosis, is inactivated by caspase cleavage.
Figures
Similar articles
-
Signal-dependent protection from apoptosis in mice expressing caspase-resistant Rb.Nat Cell Biol. 2002 Oct;4(10):757-65. doi: 10.1038/ncb853. Nat Cell Biol. 2002. PMID: 12360286
-
Blockade of tumor necrosis factor-induced Bid cleavage by caspase-resistant Rb.J Biol Chem. 2007 Oct 5;282(40):29401-13. doi: 10.1074/jbc.M702261200. Epub 2007 Aug 8. J Biol Chem. 2007. PMID: 17686781
-
Caspase-dependent cleavage of the retinoblastoma protein is an early step in neuronal apoptosis.Oncogene. 2000 Apr 27;19(18):2171-8. doi: 10.1038/sj.onc.1203532. Oncogene. 2000. PMID: 10822366
-
Role of retinoblastoma tumor suppressor protein in DNA damage response.Acta Oncol. 2001;40(6):689-95. doi: 10.1080/02841860152619098. Acta Oncol. 2001. PMID: 11765062 Review.
-
RB and apoptotic cell death.Front Biosci. 1998 Apr 6;3:d419-30. doi: 10.2741/a288. Front Biosci. 1998. PMID: 9545437 Review.
Cited by
-
BCG immunotherapy inhibits cancer progression by promoting the M1 macrophage differentiation of THP‑1 cells via the Rb/E2F1 pathway in cervical carcinoma.Oncol Rep. 2021 Nov;46(5):245. doi: 10.3892/or.2021.8196. Epub 2021 Sep 28. Oncol Rep. 2021. PMID: 34581419 Free PMC article.
-
NLRC5 senses NAD+ depletion, forming a PANoptosome and driving PANoptosis and inflammation.Cell. 2024 Jul 25;187(15):4061-4077.e17. doi: 10.1016/j.cell.2024.05.034. Epub 2024 Jun 14. Cell. 2024. PMID: 38878777 Free PMC article.
-
Immunohistochemical analysis of retinoblastoma and β-catenin as an assistant tool in the differential diagnosis between Crohn's disease and ulcerative colitis.PLoS One. 2013 Aug 14;8(8):e70786. doi: 10.1371/journal.pone.0070786. eCollection 2013. PLoS One. 2013. PMID: 23967107 Free PMC article.
-
Human intestinal MUC17 mucin augments intestinal cell restitution and enhances healing of experimental colitis.Int J Biochem Cell Biol. 2010 Jun;42(6):996-1006. doi: 10.1016/j.biocel.2010.03.001. Epub 2010 Mar 6. Int J Biochem Cell Biol. 2010. PMID: 20211273 Free PMC article.
-
Mutating RBF can enhance its pro-apoptotic activity and uncovers a new role in tissue homeostasis.PLoS One. 2014 Aug 4;9(8):e102902. doi: 10.1371/journal.pone.0102902. eCollection 2014. PLoS One. 2014. PMID: 25089524 Free PMC article.
References
-
- Hanahan, D. & Weinberg, R. A. (2000) Cell 100, 57–70. - PubMed
-
- Sherr, C. J. & McCormick, F. (2002) Cancer Cell 2, 103–112. - PubMed
-
- Chau, B. N. & Wang, J. Y. (2003) Nat. Rev. Cancer 3, 130–138. - PubMed
-
- Liu, H., Dibling, B., Spike, B., Dirlam, A. & Macleod, K. (2004) Curr. Opin. Genet. Dev. 14, 55–64. - PubMed
-
- Mittnacht, S. (2005) Eur. J. Cell Biol. 84, 97–107. - PubMed
Publication types
MeSH terms
Substances
Grants and funding
LinkOut - more resources
Full Text Sources
Medical
Molecular Biology Databases
Research Materials
Miscellaneous
