

Superimposition of 3D cone-beam CT models of orthognathic surgery patients
- PMID: 16227481
- PMCID: PMC3552302
- DOI: 10.1259/dmfr/17102411
Superimposition of 3D cone-beam CT models of orthognathic surgery patients
Abstract
Objectives: To evaluate the registration of 3D models from cone-beam CT (CBCT) images taken before and after orthognathic surgery for the assessment of mandibular anatomy and position.
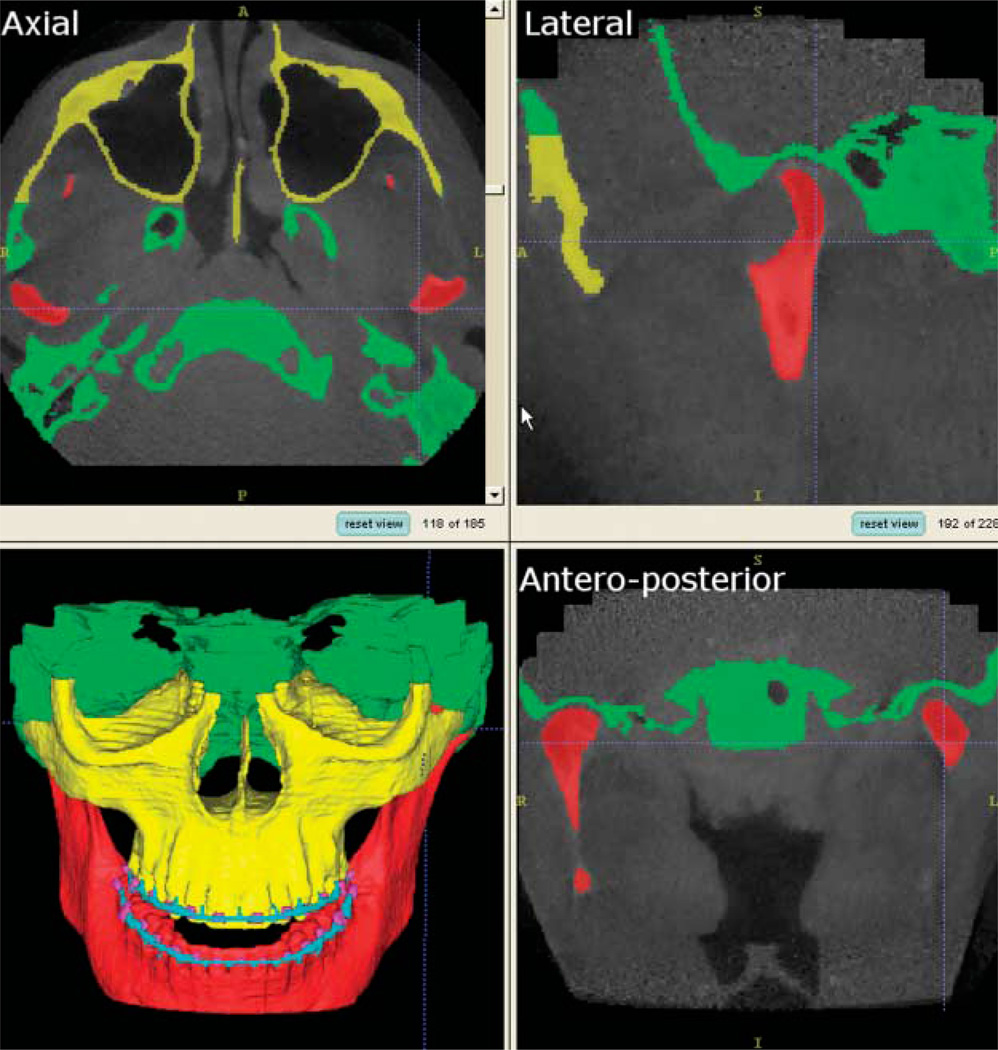
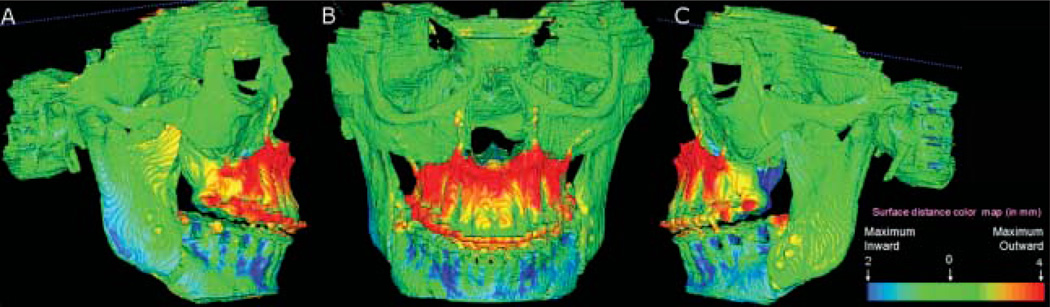
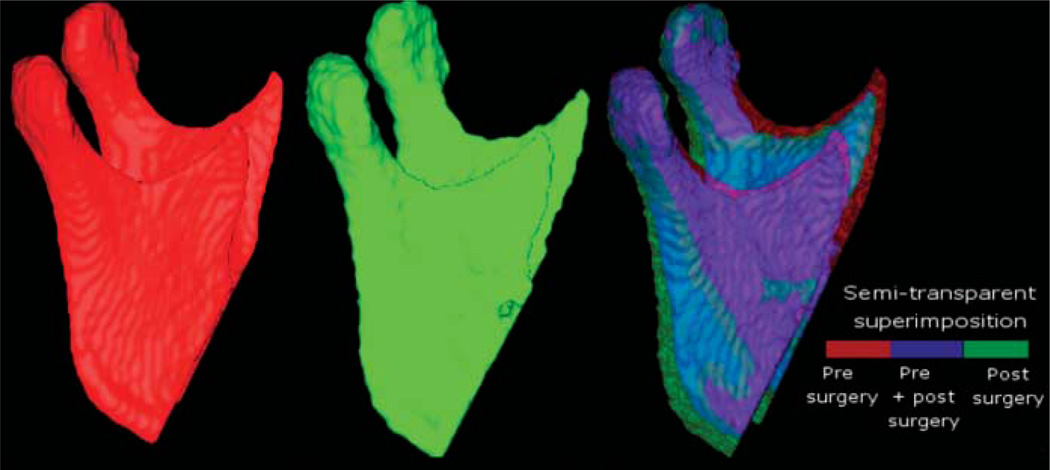
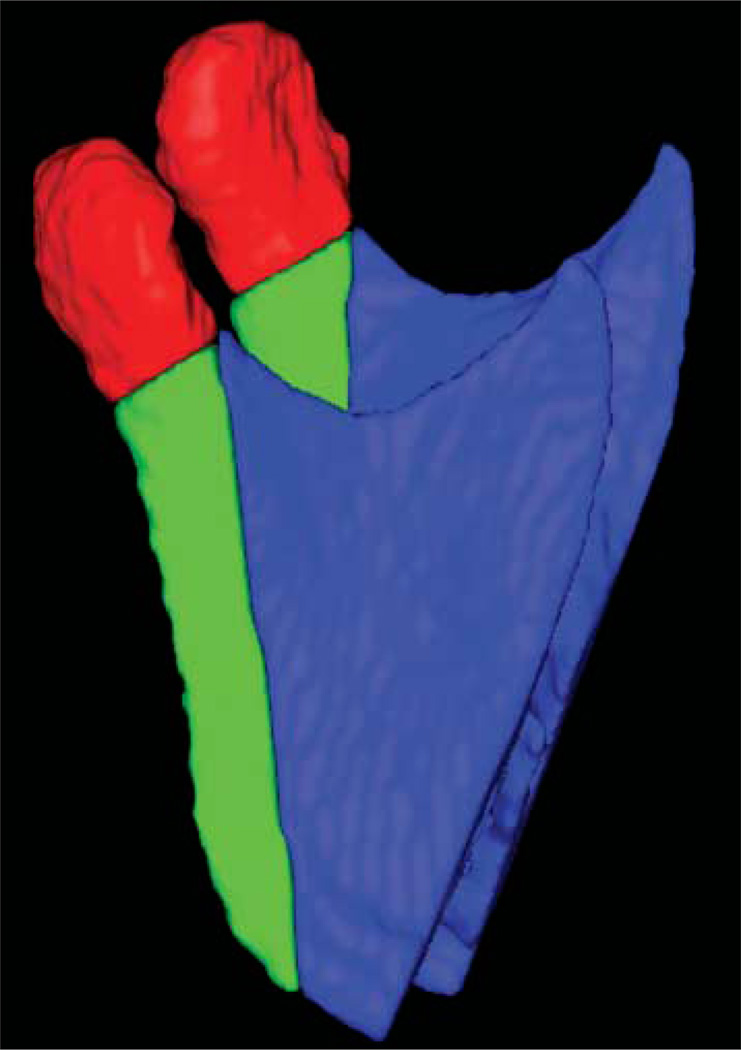
Methods: CBCT scans were taken before and after orthognathic surgery for ten patients with various malocclusions undergoing maxillary surgery only. 3D models were constructed from the CBCT images utilizing semi-automatic segmentation and manual editing. The cranial base was used to register 3D models of pre- and post-surgery scans (1 week). After registration, a novel tool allowed the visual and quantitative assessment of post-operative changes via 2D overlays of superimposed models and 3D coloured displacement maps.
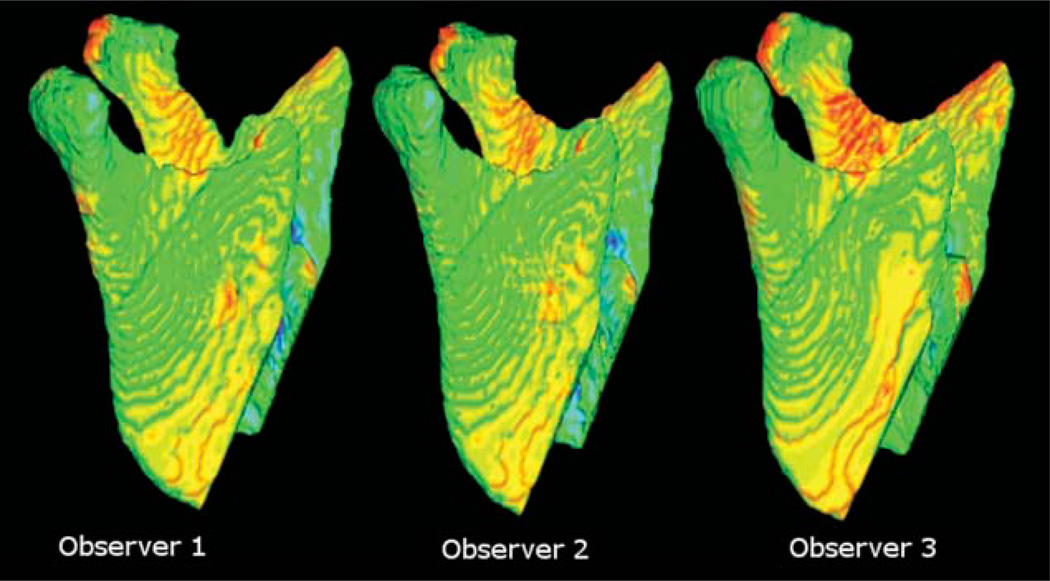
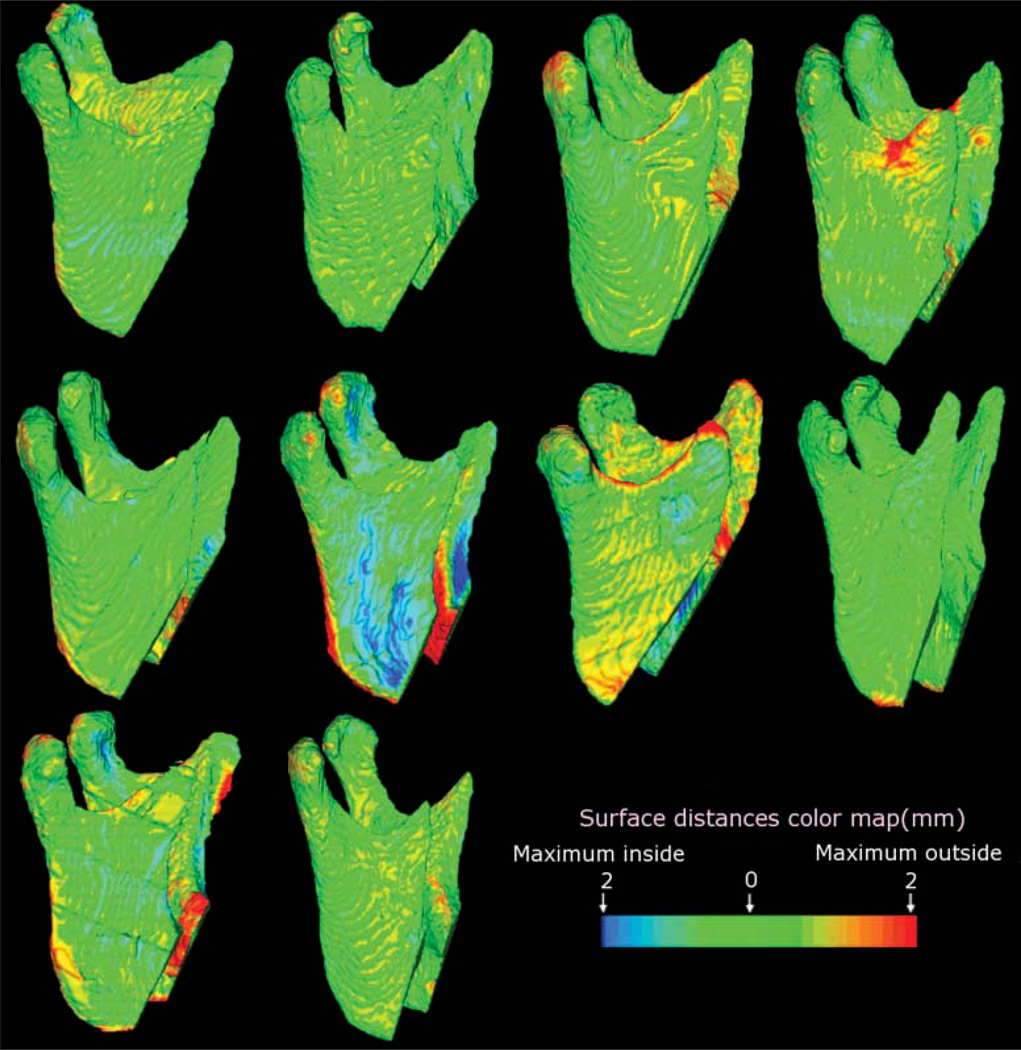
Results: 3D changes in mandibular rami position after surgical procedures were clearly illustrated by the 3D colour-coded maps. The average displacement of all surfaces was 0.77 mm (SD=0.17 mm), at the posterior border 0.78 mm (SD=0.25 mm), and at the condyle 0.70 mm (SD=0.07 mm). These displacements were close to the image spatial resolution of 0.60 mm. The average interobserver differences were negligible. The range of the interobserver errors for the average of all mandibular rami surface distances was 0.02 mm (SD=0.01 mm).
Conclusion: Our results suggest this method provides a valid and reproducible assessment of craniofacial structures for patients undergoing orthognathic surgery. This technique may be used to identify different patterns of ramus and condylar remodelling following orthognathic surgery.
Figures
References
-
- Hajeer MJ, Ayoub AF, Millett DT, Bock M, Siebert JP. Three-dimensional imaging in orthognathic surgery: The clinical application of a new method. Int J Adult Orthod Orthognath Surg. 2002;17:318–330. - PubMed
-
- Mah J, Hatcher D. Three-dimensional craniofacial imaging. Am J Orthod Dentofac Orthop. 2004;126:308–309. - PubMed
-
- Ludlow JB, Davies-Ludlow LE, Brooks SL. Dosimetry of two extraoral direct digital imaging devices: NewTom cone beam CT and Orthophos Plus DS panoramic unit. Dentomaxillofac Radiol. 2003;32:229–234. - PubMed
-
- Chirani RA, Jacq JJ, Meriot P, Roux C. Temporomandibular joint: A methodology of magnetic resonance imaging 3-D reconstruction. Oral Surg Oral Med Oral Pathol Oral Radiol Endod. 2004;97:756–761. - PubMed
-
- Ono I, Ohura T, Narumi E, Kawashima K, Matsuno I, Nakamura S, et al. Three-dimensional analysis of craniofacial bones using three-dimensional computer tomography. J Craniomaxillofac Surg. 1992;20:49–60. - PubMed
