. 2005 Nov;25(21):9318-23.
doi: 10.1128/MCB.25.21.9318-9323.2005.

Clathrin adaptor AP-2 is essential for early embryonal development

Affiliations

Clathrin adaptor AP-2 is essential for early embryonal development

Takashi Mitsunari et al. Mol Cell Biol. 2005 Nov.

Abstract

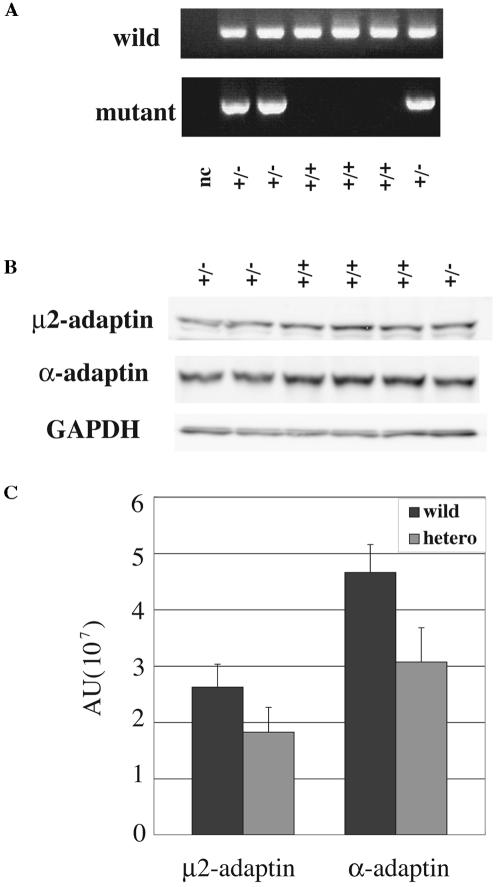
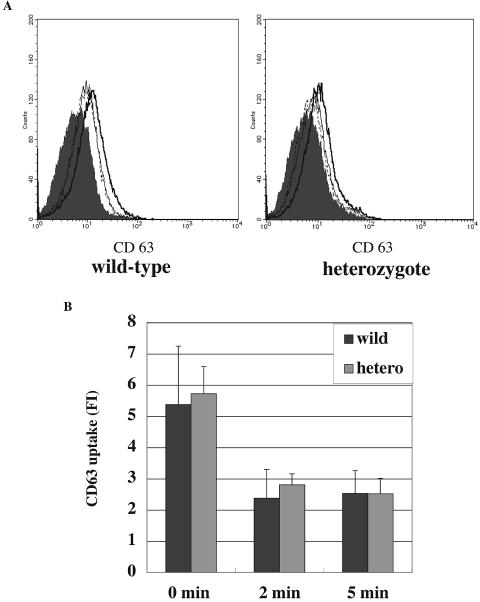
The heterotetrameric adaptor protein (AP) complexes AP-1, AP-2, AP-3, and AP-4 play key roles in transport vesicle formation and cargo sorting in post-Golgi trafficking pathways. Studies on cultured mammalian cells have shown that AP-2 mediates rapid endocytosis of a subset of plasma membrane receptors. To determine whether this function is essential in the context of a whole mammalian organism, we carried out targeted disruption of the gene encoding the mu2 subunit of AP-2 in the mouse. We found that mu2 heterozygous mutant mice were viable and had an apparently normal phenotype. In contrast, no mu2 homozygous mutant embryos were identified among blastocysts from intercrossed heterozygotes, indicating that mu2-deficient embryos die before day 3.5 postcoitus (E3.5). These results indicate that AP-2 is indispensable for early embryonic development, which might be due to its requirement for cell viability.


Figures

FIG. 1.
FIG. 1.
Establishment of μ2 mutant mice. (A) Schematic representation of the genomic structure of wild-type mice (upper), the targeting vector (middle), and mutant mice (lower). Exons are indicated by filled boxes. Restriction enzyme sites are denoted as follows: E, EcoRI; H, HindIII. The 3′ probe detects a 12-kb band for the mutant allele and a 6-kb band for the wild-type allele in HindIII digestion. (B) Southern blot analysis of littermates from heterozygote intercrossing. The resulting genotypes are indicated over each lane. Note that no homozygous mutants (i.e., yielding only the upper band) were obtained. (C) Schematic representation of the blastocyst genotyping done by nested PCR. The positions of the first- and second-round primers for both genotypes are depicted. (D) Genotyping of littermates by nested PCR. The resulting genotypes are indicated below each lane. Distilled water was used as a template for the negative control (nc; lane 1). Note that no homozygous mutant blastocysts were detected.
FIG. 2.
FIG. 2.
Expression of μ2 and α proteins in μ2+/− and μ2+/− MEFs. (A) Genotyping of MEFs by PCR. These cell lines were established from embryos obtained by crossing wild-type females with heterozygous males. The resulting genotypes are indicated below each lane. Distilled water was used as a template for the negative control (nc; lane 1). (B) Western blot analysis of μ2 and α proteins in μ2+/− and μ2+/− MEFs. Glyceraldehyde-3-phosphate dehydrogenase (GAPDH) was used as internal control for the amount of protein in each lane. (C) The results shown in panel B were quantified. The amount of protein in each lane was corrected by the amount of GAPDH. Results are expressed as mean ± standard deviation from three experiments.
FIG. 3.
FIG. 3.
Kinetics of the internalization of CD63 in MEFs. MEFs were allowed to internalize an antibody to mouse CD63 for the indicated times (0, 2, or 5 min) at 37°C. This was followed by staining with secondary antibody to detect the anti-CD63 antibody remaining on the cell surface by FACS analysis. (A) Histograms showing CD63 expression on wild-type (left bar) and heterozygote (right bar) MEFs. The thin solid line, thick solid line, and dotted line represent surface expression at 0, 2, and 5 min of incubation, respectively. The gray curve corresponds to a negative staining control. (B) Kinetics of CD63 internalization. Data represent the amount of anti-CD63 antibody remaining on the surface after the indicated incubation times. FI, fluorescent intensity. Results are expressed as mean ± standard deviation from three experiments.

Similar articles

Cited by

References

    1. Adra, C. N., P. H. Boer, and M. W. McBurney. 1987. Cloning and expression of the mouse pgk-1 gene and the nucleotide sequence of its promoter. Gene 60:65-74. - PubMed
    1. Aguilar, R. C., H. Ohno, K. W. Roche, and J. S. Bonifacino. 1997. Functional domain mapping of the clathrin-associated adaptor medium chains μ1 and μ2. J. Biol. Chem. 272:27160-27166. - PubMed
    1. Bonifacino, J. S., and E. C. Dell'Angelica. 1999. Molecular bases for the recognition of tyrosine-based sorting signals. J. Cell Biol. 145:923-926. - PMC - PubMed
    1. Brodsky, F. M., C. Y. Chen, C. Knuehl, M. C. Towler, and D. E. Wakeham. 2001. Biological basket weaving: formation and function of clathrin-coated vesicles. Annu. Rev. Cell Dev. Biol. 17:517-568. - PubMed
    1. Conner, S. D., and S. L. Schmid. 2003. Differential requirements for AP-2 in clathrin-mediated endocytosis. J. Cell Biol. 162:773-779. - PMC - PubMed

Publication types

Substances