. 2005 Nov;25(21):9350-9.
doi: 10.1128/MCB.25.21.9350-9359.2005.

Nuclear dynamics of PCNA in DNA replication and repair

Affiliations

Nuclear dynamics of PCNA in DNA replication and repair

Jeroen Essers et al. Mol Cell Biol. 2005 Nov.

Abstract

The DNA polymerase processivity factor proliferating cell nuclear antigen (PCNA) is central to both DNA replication and repair. The ring-shaped homotrimeric PCNA encircles and slides along double-stranded DNA, acting as a "sliding clamp" that localizes proteins to DNA. We determined the behavior of green fluorescent protein-tagged human PCNA (GFP-hPCNA) in living cells to analyze its different engagements in DNA replication and repair. Photobleaching and tracking of replication foci revealed a dynamic equilibrium between two kinetic pools of PCNA, i.e., bound to replication foci and as a free mobile fraction. To simultaneously monitor PCNA action in DNA replication and repair, we locally inflicted UV-induced DNA damage. A surprisingly longer residence time of PCNA at damaged areas than at replication foci was observed. Using DNA repair mutants, we showed that the initial recruitment of PCNA to damaged sites was dependent on nucleotide excision repair. Local accumulation of PCNA at damaged regions was observed during all cell cycle stages but temporarily disappeared during early S phase. The reappearance of PCNA accumulation in discrete foci at later stages of S phase likely reflects engagements of PCNA in distinct genome maintenance processes dealing with stalled replication forks, such as translesion synthesis (TLS). Using a ubiquitination mutant of GFP-hPCNA that is unable to participate in TLS, we noticed a significantly shorter residence time in damaged areas. Our results show that changes in the position of PCNA result from de novo assembly of freely mobile replication factors in the nucleoplasmic pool and indicate different binding affinities for PCNA in DNA replication and repair.


Figures
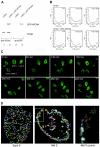
FIG. 1.
FIG. 1.
Characterization of CHO9 cells expressing GFP-hPCNA. (A) Immunoblot analysis. Whole-cell extracts of CHO9 cells and CHO9 cells stably expressing GFP-hPCNA were analyzed for the presence of endogenous PCNA and GFP-hPCNA by immunoblotting using antibodies against PCNA (left panel) and GFP (right panel). (B) Cell cycle analyses. CHO9 cells and CHO9 cells expressing GFP-hPCNA were irradiated with UV light (10 J/m2). After the indicated time points, the cells were analyzed for DNA content using a fluorescence-activated cell sorter. In each histogram, the counted cells are plotted against the relative fluorescence intensities derived from the propidium iodide signal. (C) Time-lapse imaging of four cells expressing GFP-hPCNA. Cells were imaged every 10 min during a 5-h period. Shown are the images taken every 60 min. All four cells will go through cell division and follow the characteristic PCNA focal pattern. Small dots are characteristic for early S phase, staining at the periphery of the nucleus marks the mid-S phase, and big blobs mark the late S phase. The G2 cell divided first and, depending on their stages in S phase, the other cells followed. (D) Analysis of movement of PCNA replication structures in living cells done by tracking individual PCNA replication structures in single cells. In the background, the PCNA staining pattern at time point zero is shown in grayscale. Positions of the centers of replication structures were determined in each frame of a movie from the focal plane of a cell, and consecutive positions were connected by lines. Cells were examined for 30 min using time-lapse video microscopy at intervals of 30 s. The coordinates of each focus in the cell were determined at every 30-s time interval (Volocity; Improvision). Each individually colored track represents the movement of a different focus during the period captured. The last image shows the zoom image of the mid-S-phase cell.
FIG. 2.
FIG. 2.
Accumulation of DNA repair proteins at sites of local UV-induced damage. (A) Upper panels: XPB and CPDs colocalize. CHO cells deficient in XPB (27-1) complemented with XPB-GFP were locally UV irradiated (locally damaged cells are indicated with the arrows). One hour after UV irradiation, DNA damage was detected with antibodies against CPDs (shown in red), and XPB-GFP accumulation was detected with antibodies against GFP (shown in green). Colocalization of XPB and CPDs is demonstrated in the merged image. Middle panels: PCNA and CPDs display colocalization. CHO9 cells expressing GFP-hPCNA were locally UV irradiated. One hour after UV irradiation, cells were fixed, DNA was denatured, and DNA damage was detected by indirect immunofluorescence using antibodies against CPDs (shown in red). GFP-hPCNA was also detected by indirect immunofluorescence using antibodies against GFP (shown in green). Shown are three GFP-hPCNA-expressing cells in different stages of the cell cycle. On top of the replication pattern of PCNA, one cell shows local accumulation of GFP-hPCNA, which colocalizes with the CPD signal (shown in yellow in the merged image). Bottom panels: No colocalization of PCNA and CPDs in a NER-deficient cell line, UV135, which is deficient in XPG. Locally irradiated UV135 cells expressing GFP-hPCNA were fixed 1 hour after irradiation and stained using antibodies against GFP (in green) and CPDs (in red). The bottom cell shows local accumulation of CPDs but no accumulation of PCNA. (B) Quantitation of the results shown in Fig. 2A, middle and bottom panels. The percentages of local CPD accumulations that also show local PCNA accumulation after local UV irradiation were determined at the indicated time points for CHO9 and UV135 cells. For all cell lines, 65 to 70 cells were examined. (C) Time-lapse imaging of GFP-hPCNA in cells treated with local UV damage shows transient accumulation of GFP-hPCNA (indicated by the circles) at sites of local UV damage in different stages of the cell cycle. Based on the PCNA replication pattern, the upper cell was at the transition from the G1 phase to the early S phase, and the lower cell was in the early S phase. In the upper cell, this local GFP-hPCNA accumulation disappeared for a short period during the early S phase but reappeared at the transition from the early S phase to the mid-S phase. In the lower cell, the local GFP-hPCNA accumulation disappeared in the G2 phase and the subsequent G1 phase in the daughter cells. Note the decrease in fluorescence signal around mitosis as a result of cells rounding up and detaching from the coverslips. (D) Colocalization of PCNA and Rad51 at site of local damage. Chinese hamster ovary cells stably expressing both YFP-hPCNA and CFP-hRAD51 were locally UV irradiated. Cells were fixed 1, 4, 8, and 16 h after UV irradiation, and local accumulation of PCNA and Rad51 was directly detected using the appropriate filter sets (Chroma) to discriminate between cyan fluorescent protein and yellow fluorescent protein. At all these different time points, we found examples of local accumulations of PCNA (shown in green) and Rad51 (shown in red) during S phase, where the focal pattern of PCNA partly colocalized with the focal pattern of Rad51 (shown in the merged image).
FIG. 3.
FIG. 3.
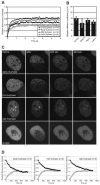
Fluorescence redistribution after photobleaching analyses of GFP-hPCNA before DNA damage induction. Cells stably expressing PCNA fused to GFP were subjected to a local bleach pulse, and the kinetics of fluorescence recovery in the bleached area was determined. (A) The fluorescence in a small strip spanning the entire nucleus was bleached with a 200-ms high-intensity laser pulse. The recovery of fluorescence in the strip was monitored at intervals of 100 ms, and the measured fluorescence intensities over time were plotted. This photobleaching protocol was applied to GFP-hPCNA-expressing cells in the different stages of the cell cycle. To determine the immobile fractions, the final measured fluorescence intensity was normalized to the prebleaching pulse fluorescence intensity. (B) Diffusion coefficient of GFP-hPCNA in different stages of the cell cycle. To determine the Deff, the fluorescence intensity immediately after bleaching and the final postbleaching pulse fluorescence intensity measured were normalized between zero and one. The Deffs in the different stages of the cell cycle were determined by fitting the experimentally obtained curves to a mathematical model describing diffusion (6). Measurements were performed in triplicate, and consistent results were obtained among different sets of experiments. Error bars indicate twice the standard errors of the mean. (C) Fluorescence loss in photobleaching and fluorescence redistribution after photobleaching of GFP-hPCNA in different stages of the cell cycle. The lower region of a cell containing replication foci was bleached by a single laser pulse. The cell was imaged at the indicated times after bleaching. FLIP was measured in the unbleached half of the cell, while FRAP was measured in the bleached half of the same cell. The same experimental protocol was applied to cells in the early, mid-, and late S and G1/G2 phases of the cell cycle. (D) Quantitation of the simultaneous FRAP and FLIP experiment on GFP-hPCNA replication foci. “n” represents the number of cells examined.
FIG. 4.
FIG. 4.
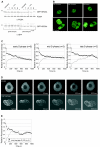
Fluorescence redistribution after photobleaching analyses of GFP-hPCNA in locally UV-irradiated cells. (A) Example of FLIP/FRAP analysis in locally irradiated cells. The upper panel represents a cell in the G1 or G2 phase of the cell cycle and shows local accumulation of GFP-hPCNA in the damaged area. The lower part of the cell, including half of the site of local damage, was photobleached, and the cell was imaged every 30 s. A similar experiment (lower panel) was done on a cell that was, based on the PCNA staining pattern, in the early S phase of the cell cycle. (B) Quantitation of the simultaneous FRAP and FLIP experiments on GFP-hPCNA after local UV damage on G1/G2-phase cells. “n” represents the number of cells examined.
FIG. 5.
FIG. 5.
Characterization of mutant GFP-hPCNAK164R localization and kinetics in DNA replication and repair. (A) Substitution of the lysine residue at position 164 for arginine (K164R) results in defective monoubiquitination of GFP-hPCNA. Cells expressing GFP-hPCNA or GFP-hPCNAK164R were treated with 10 J/m2 (lanes 1 and 2) or 20 J/m2 (lanes 3 and 4) UV, and cell lysates were prepared after 4 h (lanes 1 and 3) or 6 h (lanes 2 and 4). The protein blot shows total cell lysates of UV-treated and untreated cells probed with anti-PCNA antibodies (upper blot) and GFP antibodies (lower blot). Indicated are the positions of endogenous PCNA, GFP-hPCNA, and monoubiquitinated GFP-hPCNA (*). (B) Time-lapse imaging experiments on GFP-hPCNAK164R-expressing cells. Upper panels: time-lapse imaging of untreated cells expressing GFP-hPCNAK164R. An example of a cell imaged from the mid-S phase to the G2 phase of the cell cycle is shown. Lower panels: time-lapse imaging of locally irradiated cell (indicated with the circle) showing transient accumulation of GFP-hPCNAK164R at sites of UV damage. (C to E) Fluorescence redistribution after photobleaching analyses of mutant GFP-hPCNAK164R-expressing cells. (C) Quantitative FLIP/FRAP analysis of mutant GFP-hPCNAK164R replication foci in the early, mid-, and late S phases of the cell cycle. (D) Examples of FLIP/FRAP analysis in locally irradiated mutant cells. The upper panel represents a GFP-hPCNAK164R-expressing cell, which, based upon the diffuse PCNA pattern, is in the G1 or G2 phase of the cell cycle and shows local accumulation of GFP-hPCNAK164R in the damaged area. The lower part of this cell, including half of the site of local damage, was photobleached, and the cell was imaged every 30 s. A similar experiment (lower panel) was done on a cell that was, based on the peripheral PCNA staining pattern, in the mid-S phase of the cell cycle. (E) Quantitation of the simultaneous FRAP and FLIP experiment on GFP-hPCNAK164R after local UV damage in G1/G2 cells as shown in Fig. 5D, upper panel. “n” represents the number of cells examined.

Similar articles

Cited by

References

    1. Aboussekhra, A., and R. D. Wood. 1995. Detection of nucleotide excision repair incisions in human fibroblasts by immunostaining for PCNA. Exp. Cell Res. 221:326-332. - PubMed
    1. Chubb, J. R., S. Boyle, P. Perry, and W. A. Bickmore. 2002. Chromatin motion is constrained by association with nuclear compartments in human cells. Curr. Biol. 12:439-445. - PubMed
    1. Dunand-Sauthier, I., M. Hohl, F. Thorel, P. Jaquier-Gubler, S. G. Clarkson, and O. D. Scharer. 2005. The spacer region of XPG mediates recruitment to nucleotide excision repair complexes and determines substrate specificity. J. Biol. Chem. 280:7030-7037. - PubMed
    1. Ellenberg, J., E. D. Siggia, J. E. Moreira, C. L. Smith, J. F. Presley, H. J. Worman, and J. Lippincott-Schwartz. 1997. Nuclear membrane dynamics and reassembly in living cells: targeting of an inner nuclear membrane protein in interphase and mitosis. J. Cell Biol. 138:1193-1206. - PMC - PubMed
    1. Ellison, V., and B. Stillman. 2003. Biochemical characterization of DNA damage checkpoint complexes: clamp loader and clamp complexes with specificity for 5′ recessed DNA. PLoS Biol. 1:E33. - PMC - PubMed

Publication types

Substances

LinkOut - more resources