. 2005 Nov;25(21):9447-59.
doi: 10.1128/MCB.25.21.9447-9459.2005.

Dimethylation of histone H3 at lysine 36 demarcates regulatory and nonregulatory chromatin genome-wide

Affiliations

Dimethylation of histone H3 at lysine 36 demarcates regulatory and nonregulatory chromatin genome-wide

Bhargavi Rao et al. Mol Cell Biol. 2005 Nov.

Abstract

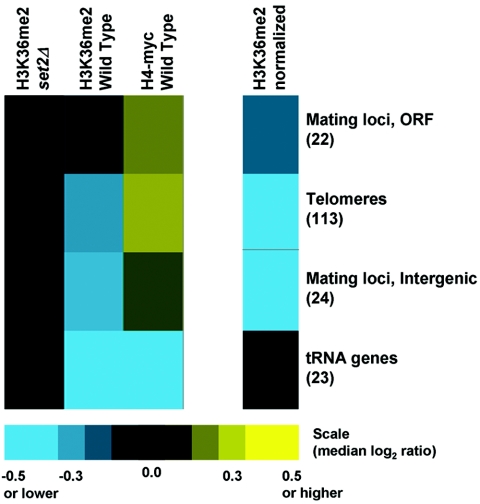
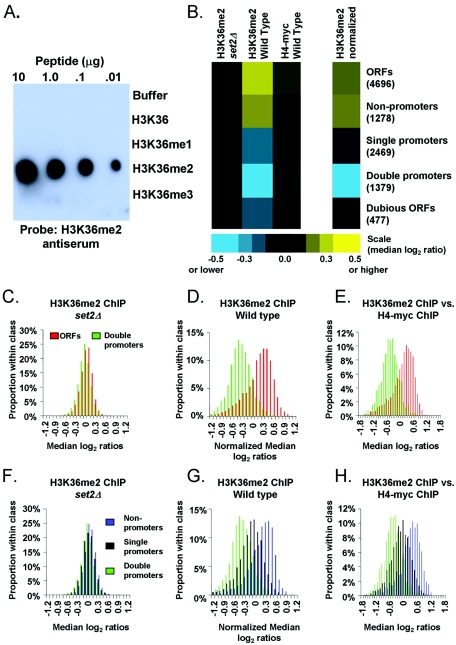
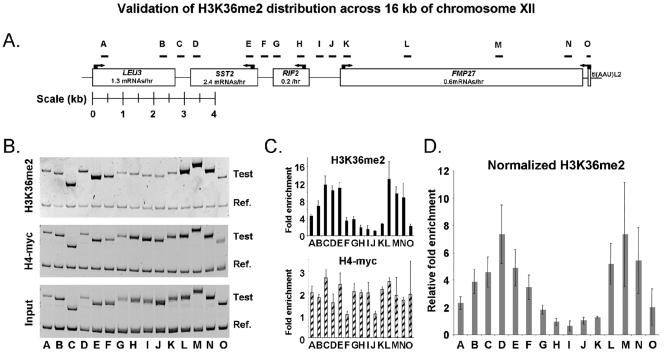
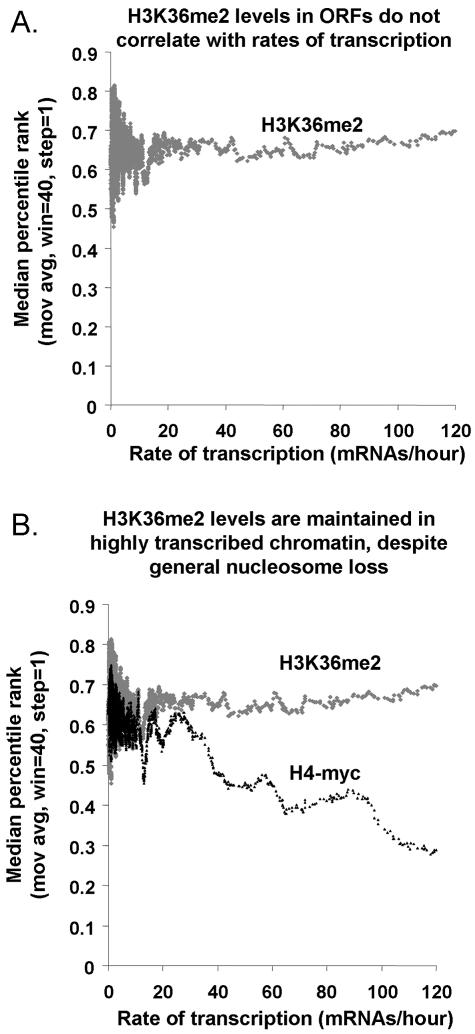
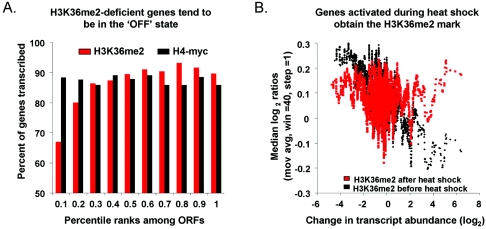
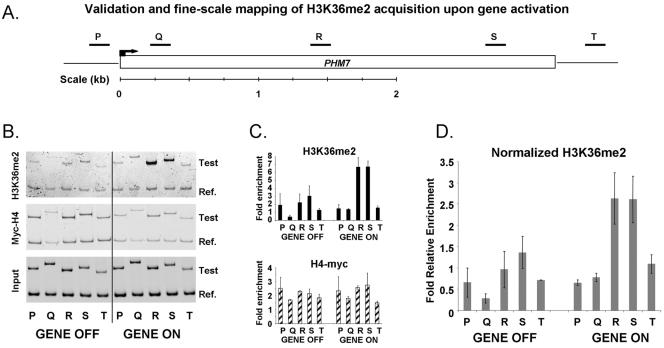
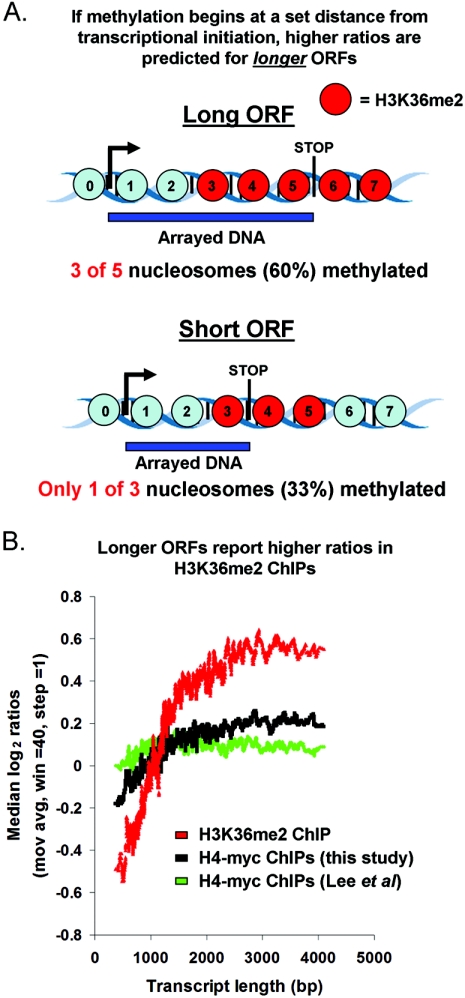
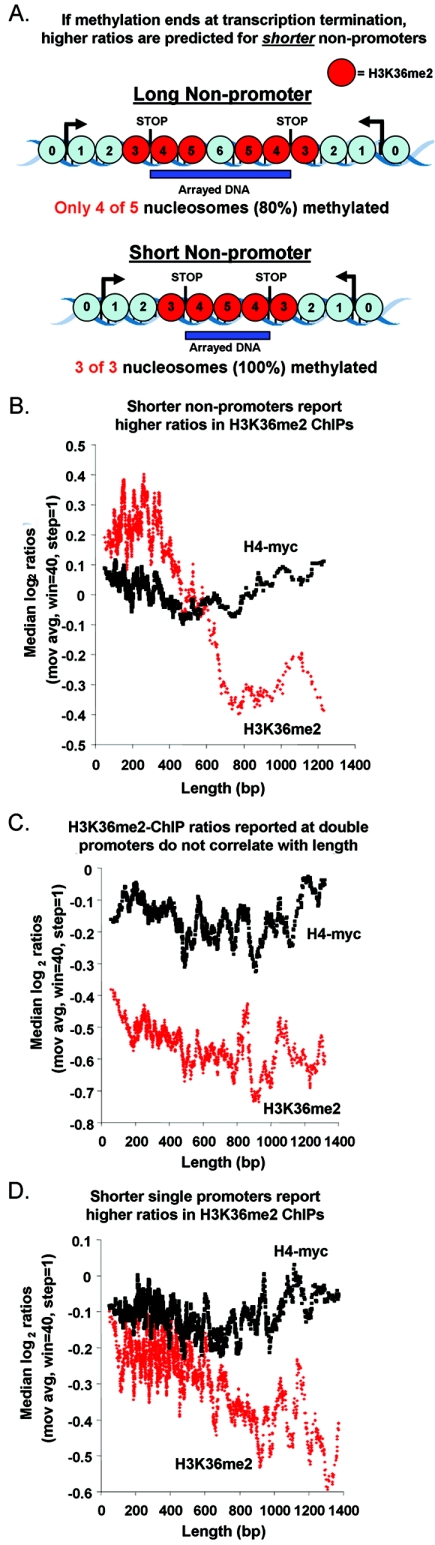
Set2p, which mediates histone H3 lysine 36 dimethylation (H3K36me2) in Saccharomyces cerevisiae, has been shown to associate with RNA polymerase II (RNAP II) at individual loci. Here, chromatin immunoprecipitation-microarray experiments normalized to general nucleosome occupancy reveal that nucleosomes within open reading frames (ORFs) and downstream noncoding chromatin were highly dimethylated at H3K36 and that Set2p activity begins at a stereotypic distance from the initiation of transcription genome-wide. H3K36me2 is scarce in regions upstream of divergently transcribed genes, telomeres, silenced mating loci, and regions transcribed by RNA polymerase III, providing evidence that the enzymatic activity of Set2p is restricted to its association with RNAP II. The presence of H3K36me2 within ORFs correlated with the "on" or "off" state of transcription, but the degree of H3K36 dimethylation within ORFs did not correlate with transcription frequency. This provides evidence that H3K36me2 is established during the initial instances of gene transcription, with subsequent transcription having at most a maintenance role. Accordingly, newly activated genes acquire H3K36me2 in a manner that does not correlate with gene transcript levels. Finally, nucleosomes dimethylated at H3K36 appear to be refractory to loss from highly transcribed chromatin. Thus, H3K36me2, which is highly conserved throughout eukaryotic evolution, provides a stable molecular mechanism for establishing chromatin context throughout the genome by distinguishing potential regulatory regions from transcribed chromatin.


Figures

FIG. 8.
FIG. 8.
H3K36me2 levels are very low or absent in transcriptionally silent and RNAP III-transcribed chromatin. Colors (scale at bottom) represent the medians of reported ChIP ratios, as described in the legend for Fig. 1B.
FIG. 1.
FIG. 1.
H3K36me2 is restricted to RNAP II-transcribed regions genome-wide. (A) The indicated amounts (top) of the specified peptides (right) were blotted onto a polyvinylidene difluoride membrane and probed with a 1:10,000 dilution of the H3K36me2 antiserum. To verify the presence of the H3K36me1 and H3K36me3 peptides, antibodies specific to each of those peptides were used in parallel to probe identical blots (see Fig. S1) in the supplemental material). (B) Colors (scale at bottom) represent the median of ratios [log2(H3K36me2 ChIP signal intensity/normalized reference signal intensity)] recorded from all arrayed elements in the indicated Saccharomyces Genome Database functional class (numbers of arrayed elements in parentheses). Data were derived from 12 independent wild-type and 8 set2Δ H3K36me2 ChIP experiments (biological replicates). Intergenic regions are organized into the following three categories: double, upstream of two divergent genes; single, upstream of one gene; non, upstream of zero genes. (C) A histogram showing the distribution of H3K36me2 ChIP median log2 ratios in a set2Δ strain. Ratios in panels C to H were normalized to bulk nucleosome occupancy by subtracting median H4-myc log2 ratios (eight independent experiments, wild type) or anti-H3 ChIPs (five independent experiments, set2Δ) from median H3K36me2 ChIP log2 ratios (same 12 ChIPs as mentioned for panel B). (D) Same as panel C, but for a wild-type strain. (E) Same as panel D, but instead of computational normalization, plotted ratios were derived from direct hybridization of H3K36me2 ChIP versus H4-myc ChIP (four independent ChIP sets). Note that for panels C to E, a positive correlation between the ratios reported at double promoters and the ratios reported at adjacent ORFs was observed (data not shown). Therefore, any high ratios reported at double promoters may, at least in part, be attributed to high ratios in adjacent ORFs. This is likely due to the limited resolution of the ChIP-chip procedure and our microarrays. (F) Same as panel C, but for noncoding regions. (G) Same as panel D, but for noncoding regions. (H) Same as panel E, but for noncoding regions.
FIG. 2.
FIG. 2.
Validation and fine-scale mapping of H3K36me2 distribution across 16 kb of chromosome XII. (A) Schematic of chromosome XII coordinates 1,036,089 to 1,052,141, showing the locations of primers used to interrogate three of the independent H3K36me2 ChIP-chips shown in Fig. 1. Primer sets are listed in Table 1. (B) Polyacrylamide gel analysis of PCR products generated by the primer sets shown in panel A (Test). The reference product (Ref.) corresponds to 146 bp of a large noncoding region between YEL073C and YEL072W on chromosome V. (C) Quantitation of the gel shown in panel B. Graphs show the average enrichments detected by the PCR primer sets following H3K36me2 and histone H4-myc ChIPs. The value plotted for each fragment was calculated as follows: [(w/x)/(y/z)], where all values are the sum of pixel intensities for each band. w, ChIP fragment; x, ChIP reference; y, input test fragment; z, input reference. Numbers therefore reflect relative immunopreciptation efficiencies; values of less than 1 may be expected. Error bars illustrate the average deviations from the means. (D) H3K36me2 enrichment values after normalization with general nucleosome occupancy levels. The values plotted were calculated as follows: [(w/x)/ (y/z)]H3K36me2/[(w/x)/(y/z)]H4-myc.
FIG. 3.
FIG. 3.
H3K36me2 levels in ORFs do not correlate with transcription frequencies. (A) Genes were sorted by their transcription rates during mitotic growth (x axis) (14), and a moving average (mov avg) (window [win] = 40, step = 1) of the degrees of their enrichment in H3K36me2 ChIPs was plotted (percentile rank, y axis). In this plot, H3K36me2 ChIP values are not normalized to overall nucleosome occupancy. (B) Same as panel A, except that both H3K36me2 ChIPs and H4-myc ChIPs are plotted.
FIG. 4.
FIG. 4.
H3K36me2 levels correlate with “on” or “off” transcriptional state. (A) ORFs were divided equally into 10 bins according to their degrees of enrichment in H3K36me2 ChIPs (normalized to H4-myc) or H4-myc ChIPs. The ORFs in each bin were then classified as either “on” (>0 mRNAs/hr) or “off” (0 mRNAs/hr). The percentage of genes in each bin that was classified as “on” is shown. We note that ORF size and transcription state are not independent variables, since shorter ORFs tend to be in the off state, even after removal of SGD-annotated dubious ORFs. However, analysis of ORFs of similar size rather than all ORFs reveals the same pattern shown here (Fig. S3 in the supplemental material). Note that ∼85% of genes are transcribed at detectable levels during mitotic growth (14, 15), so the uniform H4-myc data reflect a neutral relationship with transcription state. (B) Genes were sorted according to the degrees of their transcript level change upon heat shock (x axis) (10). A moving average (mov avg) (window [win] = 40, step = 1) of relative H3K36me2 ChIP enrichment (normalized to general histone H4 occupancy measured in parallel) at each ORF (y axis) is plotted before and after heat shock. Most genes are unchanged upon heat shock and are therefore clustered near the center of the graph. Points to the right represent ORFs that are activated by heat shock, and those to the left represent ORFs repressed by heat shock.
FIG. 5.
FIG. 5.
Validation and fine-scale mapping of H3K36me2 acquisition upon gene activation. (A) Schematic of the PHM7 locus, showing the locations of primers used to interrogate three of the independent H3K36me2 ChIP-chips shown in Fig. 4B, before and after heat shock. Primer sets are listed in Table 1. (B) Polyacrylamide gel analysis of PCR products generated by the primer sets shown in panel A (Test). The reference product (Ref.) is the same as that used for Fig. 2. (C) Quantitation of the gel shown in panel B. Graphs show the average enrichments detected by the PCR primer sets following H3K36me2 and histone H4-myc ChIPs, both before and after heat shock. The value plotted for each fragment was calculated as described in the legend for Fig. 2. (D) H3K36me2 enrichment values before and after heat shock after normalization with general nucleosome occupancy levels, calculated as described in the legend for Fig. 2. H3K36me2 levels increase after heat shock. Note that the increase is confined primarily to areas R, S, and T, which represent the center and 3′ end of the gene, but not areas P and Q, which represent, respectively, the promoter and coding sequences at the 5′ end.
FIG. 6.
FIG. 6.
Evidence that H3K36dimethylation begins at a set distance from the initiation of transcription genome-wide. (A) The hypothesis that H3K36 dimethylation begins at a determined and consistent distance from transcriptional initiation predicts that higher ratios will be reported for longer ORFs. Note that “input chromatin” is used as a reference for these experiments, and the null expectation is that the raw signal intensities in both channels will be proportional to ORF length, resulting in neutral ratios for all ORFs. The prediction of higher ratios for longer ORFs is based entirely on the relative proportion of the arrayed element that is dimethylated, not the absolute length of the arrayed element or genomic feature per se. For example, if the entire ORF were modified, or if the distance at which the modification began from transcriptional initiation were proportional to ORF length, equal ratios would be obtained for long and short ORFs. Blue circles, nucleosomes not dimethylated at H3K36. (B) ORFs were sorted by length, and moving averages (mov avg) (window [win] = 40, step = 1) of their ratios of enrichment in H3K36me2 ChIPs (not normalized to H4-myc) and H4-myc ChIPs (from this study and reference 26) were plotted.
FIG. 7.
FIG. 7.
Evidence that H3K36 dimethylation ends at transcriptional termination genome-wide. (A) The hypothesis that H3K36 dimethylation ends upon transcriptional termination predicts that higher ratios will be reported for shorter nonpromoters (see the text for details). Blue circles, nucleosomes not dimethylated at H3K36. (B) Nonpromoters were sorted by length, and moving averages (mov avg) (window [win] = 40, step = 1) of their degrees of enrichment expressed as percentile ranks in H3K36me2 ChIPs (not normalized to H4-myc) and H4-myc ChIPs were plotted. (C) Same as panel B but for double promoters. (D) Same as panel B but for single promoters.

Similar articles

Cited by

References

    1. Bannister, A. J., R. Schneider, F. A. Myers, A. W. Thorne, C. Crane-Robinson, and T. Kouzarides. 2005. Spatial distribution of di-and tri-methyl lysine 36 of histone H3 at active genes. J. Biol. Chem. 280:17732-17736. - PubMed
    1. Bernstein, B. E., C. L. Liu, E. L. Humphrey, E. O. Perlstein, and S. L. Schreiber. 2004. Global nucleosome occupancy in yeast. Genome Biol. 5:R62. - PMC - PubMed
    1. Boeger, H., J. Griesenbeck, J. S. Strattan, and R. D. Kornberg. 2003. Nucleosomes unfold completely at a transcriptionally active promoter. Mol. Cell 11:1587-1598. - PubMed
    1. Boeger, H., J. Griesenbeck, J. S. Strattan, and R. D. Kornberg. 2004. Removal of promoter nucleosomes by disassembly rather than sliding in vivo. Mol. Cell 14:667-673. - PubMed
    1. Bohlander, S. K., R. Espinosa III, M. M. Le Beau, J. D. Rowley, and M. O. Diaz. 1992. A method for the rapid sequence-independent amplification of microdissected chromosomal material. Genomics 13:1322-1324. - PubMed

Publication types