. 2005 Dec 23;280(51):42464-75.
doi: 10.1074/jbc.M504212200. Epub 2005 Oct 14.

Fatty acid transduction of nitric oxide signaling: multiple nitrated unsaturated fatty acid derivatives exist in human blood and urine and serve as endogenous peroxisome proliferator-activated receptor ligands

Affiliations

Fatty acid transduction of nitric oxide signaling: multiple nitrated unsaturated fatty acid derivatives exist in human blood and urine and serve as endogenous peroxisome proliferator-activated receptor ligands

Paul R S Baker et al. J Biol Chem. .

Abstract

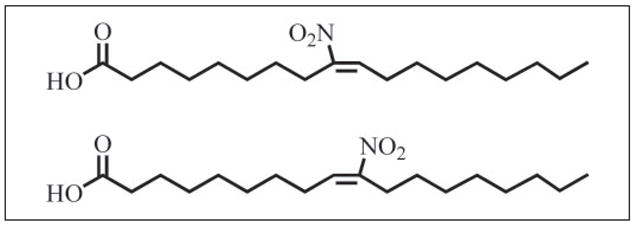
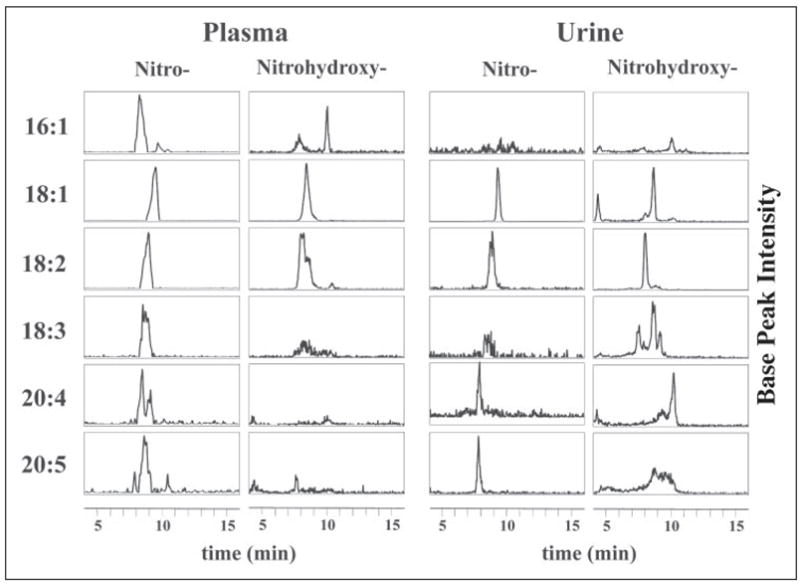
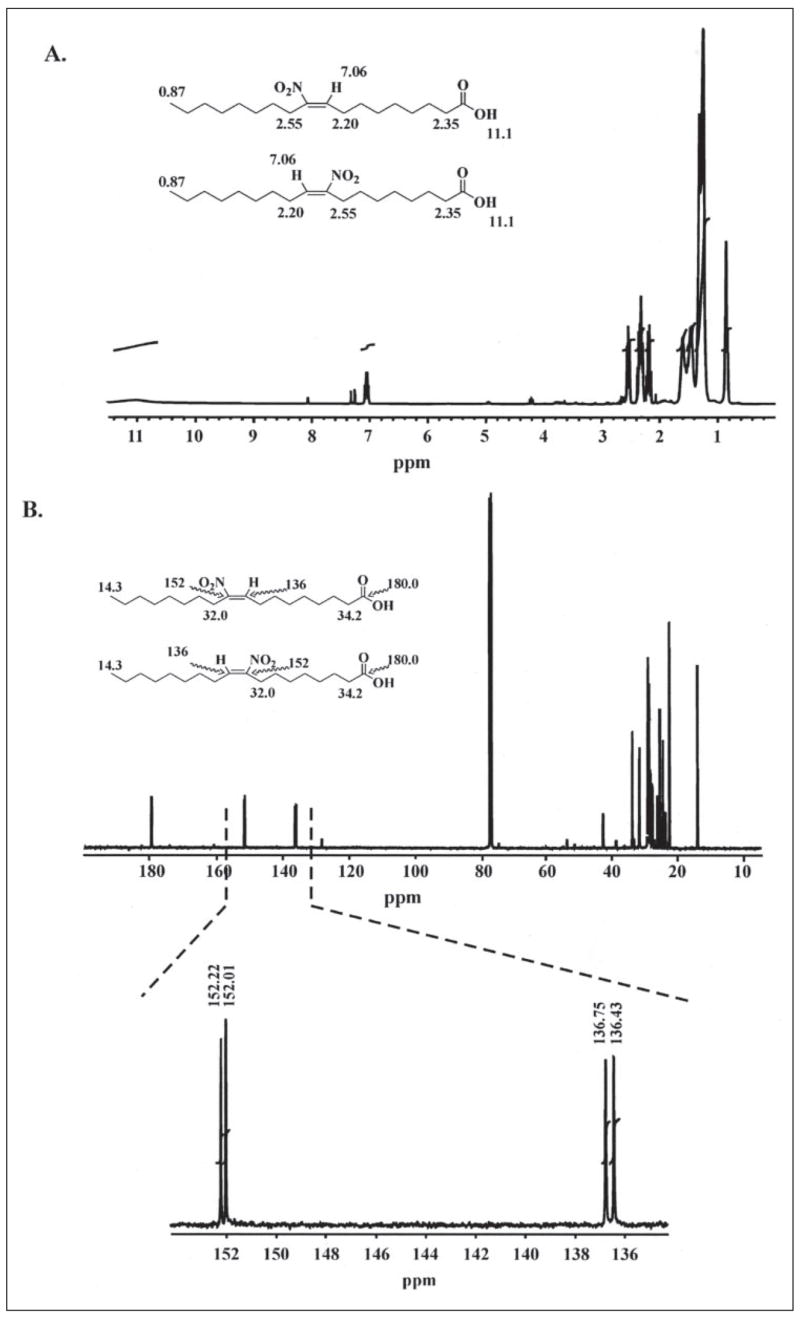
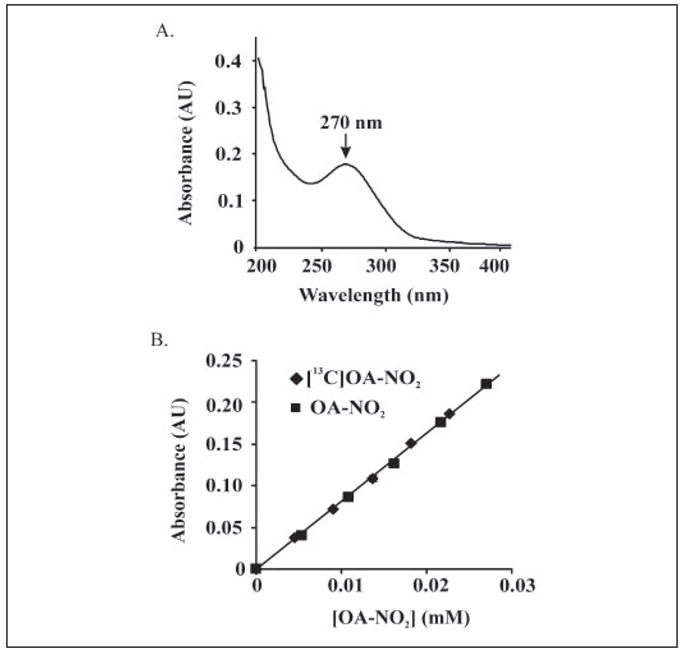
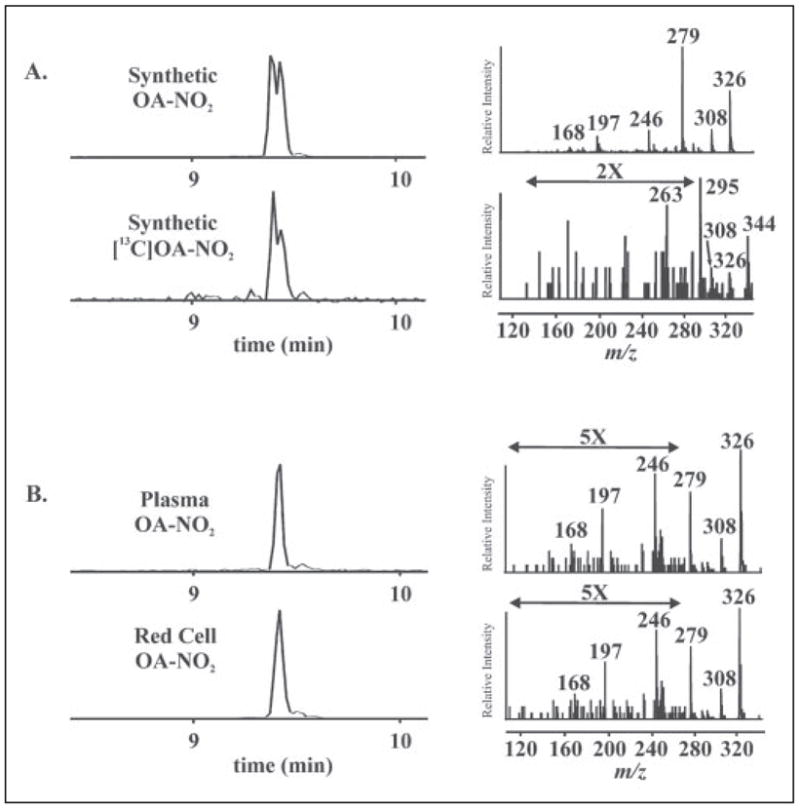
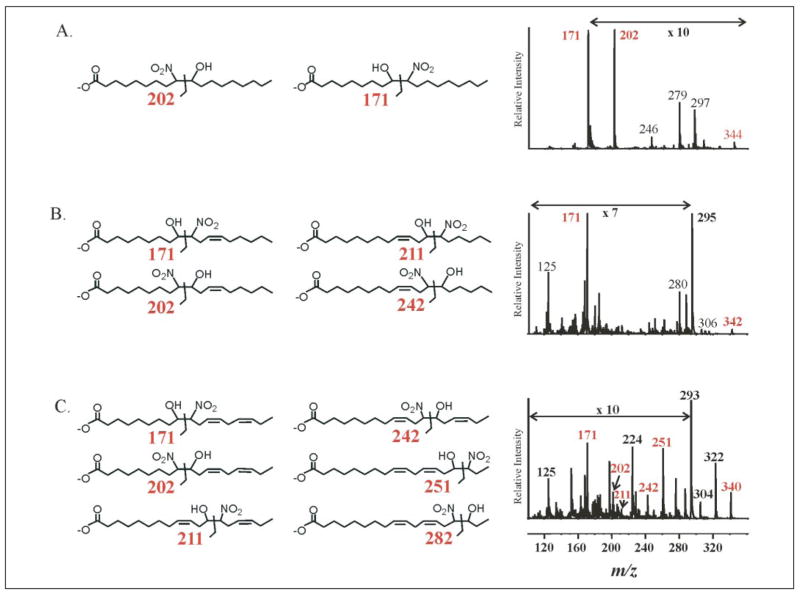
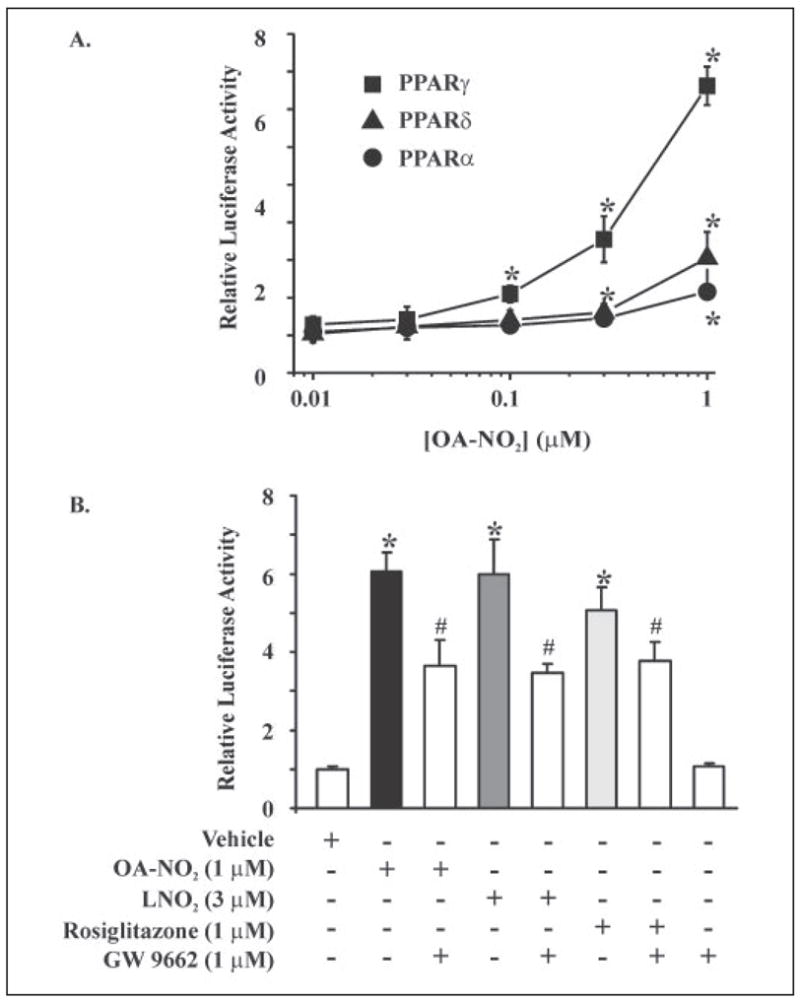
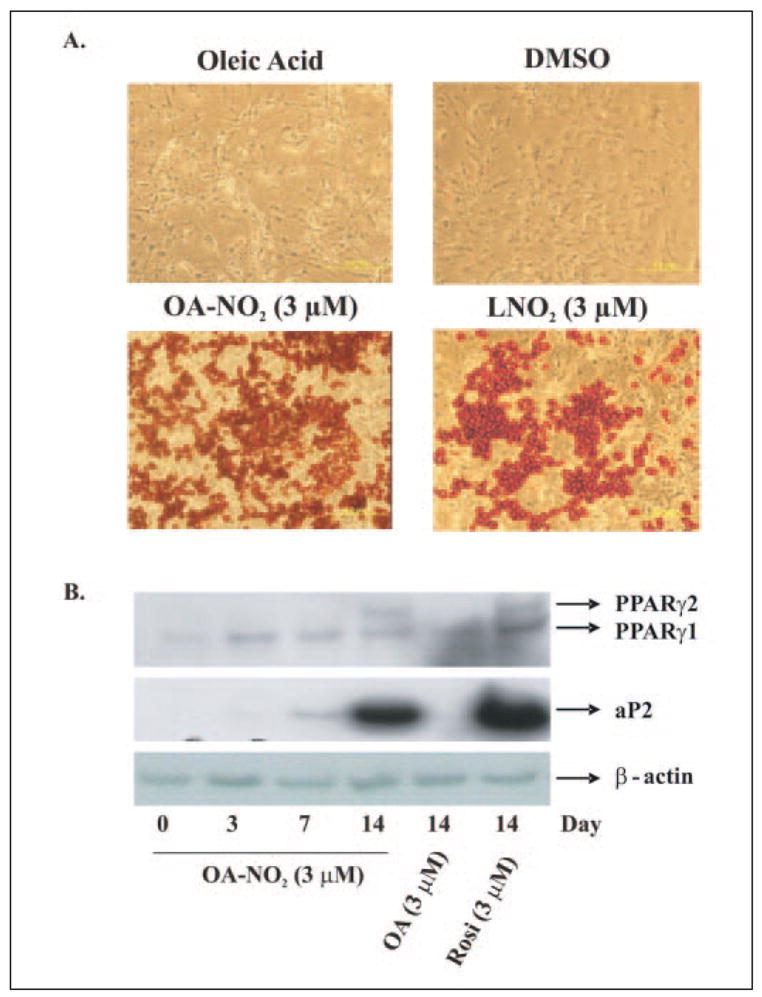
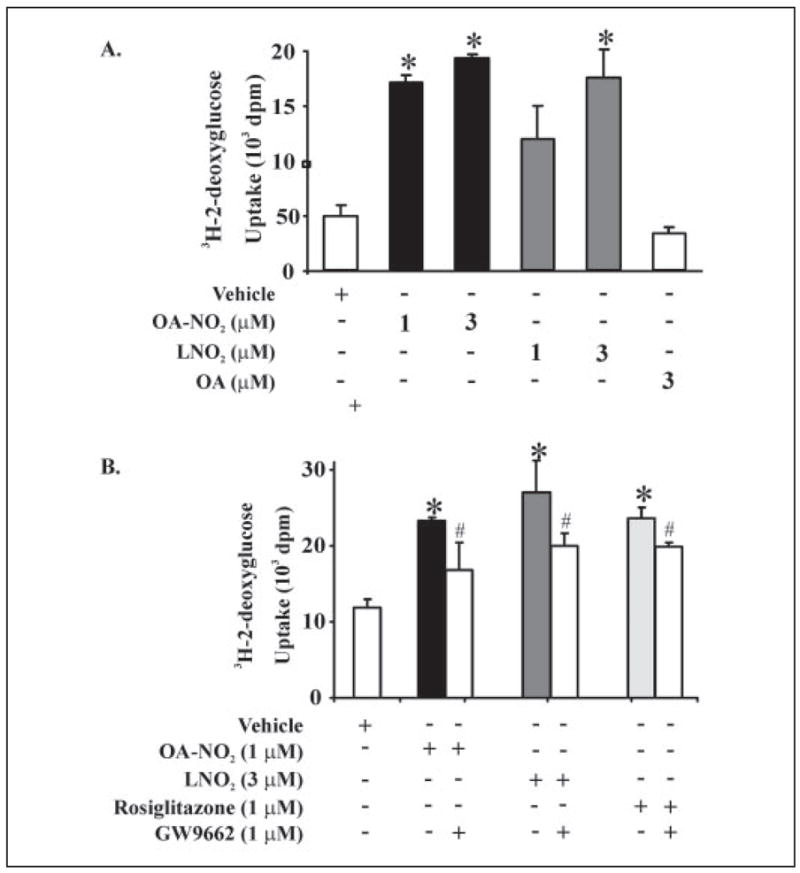
Mass spectrometric analysis of human plasma and urine revealed abundant nitrated derivatives of all principal unsaturated fatty acids. Nitrated palmitoleic, oleic, linoleic, linolenic, arachidonic and eicosapentaenoic acids were detected in concert with their nitrohydroxy derivatives. Two nitroalkene derivatives of the most prevalent fatty acid, oleic acid, were synthesized (9- and 10-nitro-9-cis-octadecenoic acid; OA-NO2), structurally characterized and determined to be identical to OA-NO2 found in plasma, red cells, and urine of healthy humans. These regioisomers of OA-NO2 were quantified in clinical samples using 13C isotope dilution. Plasma free and esterified OA-NO2 concentrations were 619 +/- 52 and 302 +/- 369 nm, respectively, and packed red blood cell free and esterified OA-NO2 was 59 +/- 11 and 155 +/- 65 nm. The OA-NO2 concentration of blood is approximately 50% greater than that of nitrated linoleic acid, with the combined free and esterified blood levels of these two fatty acid derivatives exceeding 1 microm. OA-NO2 is a potent ligand for peroxisome proliferator activated receptors at physiological concentrations. CV-1 cells co-transfected with the luciferase gene under peroxisome proliferator-activated receptor (PPAR) response element regulation, in concert with PPARgamma, PPARalpha, or PPARdelta expression plasmids, showed dose-dependent activation of all PPARs by OA-NO2. PPARgamma showed the greatest response, with significant activation at 100 nm, while PPARalpha and PPARdelta were activated at approximately 300 nm OA-NO2. OA-NO2 also induced PPAR gamma-dependent adipogenesis and deoxyglucose uptake in 3T3-L1 preadipocytes at a potency exceeding nitrolinoleic acid and rivaling synthetic thiazo-lidinediones. These data reveal that nitrated fatty acids comprise a class of nitric oxide-derived, receptor-dependent, cell signaling mediators that act within physiological concentration ranges.


Figures

FIGURE 1
FIGURE 1. Nitrated oleic acid (OA-NO2)
Two regioisomers of OA-NO2 were synthesized by nitrosenylation of oleic acid yielding 9- and 10-nitro-9-cis-octadecenoic acids.
FIGURE 2
FIGURE 2. Nitrated fatty acid derivatives in healthy human plasma and urine
Fatty acids were extracted from clinical samples and analyzed by HPLC ESI MS/MS in the negative ion mode. Nitrated fatty acid adducts (−NO2) and their nitrohydroxy derivatives (L(OH)-NO2) were detected using the MRM scan mode (TABLE ONE) and presented as HPLC elution profiles. Six fatty acids were monitored: palmitoleic acid (16:1), oleic acid (18:1), linoleic acid (18:2), linolenic acid (18:3), arachidonic acid (20:4), and eicosapentaenoic acid (20:5). In plasma and urine, all monitored nitrated fatty acids were detectable in the HPLC elution profiles with varying degrees of intensity. Each HPLC elution profile is presented with base peak intensity and does not reflect quantity relative to the other profiles. The multiple peaks in some of the elution profiles for the nitro and nitrohydroxy adducts suggest multiple stereo and/or positional isomers.
FIGURE 3
FIGURE 3. 1H and 13C NMR spectrometry of synthetic OA-NO2
Proton (A) and 13C (B) NMR spectrometry confirmed the structure of synthetic OA-NO2. Identified protons and carbons are indicated for each regioisomer; downfield shifts are presented in ppm. 13C NMR spectrometry indicates that synthetic OA-NO2 is a mixture of two regioisomers, with most carbon peaks appearing as doublets. The equal height of the doublets indicates an equal molar ratio of the regioisomers. The peaks appearing at 152 and 136 ppm are the carbons α and β to the alkenyl nitro group, respectively.
FIGURE 4
FIGURE 4. Spectrophotometric analysis of OA-NO2
A, an absorbance spectrum of OA-NO2 from 200 – 450 nm was generated using 23 μM OA-NO2 in phosphate buffer (100 mM, pH 7.4) containing 100 μM DTPA. An absorbance maximum at 270 nm was identified. B, extinction coefficients for OA-NO2 and [13C18]OA-NO2 were determined by plotting absorbance (λ270) versus concentration, resulting in calculated values of ε = 8.22 and 8.23 cm−1·mM−1, respectively.
FIGURE 5
FIGURE 5. Stability of OA-NO2 and LNO2
A, OA-NO2 and LNO2 (3 μM each) were incubated in MeOH at 37 °C and aliquots removed at periodic intervals for extraction and quantitation of the parent molecule. B, a similar analysis to A was performed, using phosphate buffer (100 mM KPO4, 100 μM DTPA, pH 7.4) rather than MeOH.
FIGURE 6
FIGURE 6. Identification and structural characterization of synthetic, plasma and red blood cell OA-NO2 by HPLC ESI MS/MS
A: left panels, OA-NO2 and [13C18]OA-NO2 were characterized by HPLC ESI MS/MS in the negative ion mode. Nitrated oleic acid species were separated by HPLC and detected by acquiring MRM transitions consistent with the loss of the nitro functional group [M-HNO2]: m/z 326/279 and m/z 344/297 for OA-NO2 and [13C18]OA-NO2, respectively. Right panels, concurrent to MRM detection, product ion analysis was performed to generate the identifying fragmentation patterns used to characterize OA-NO2 present in red cells and plasma. The predominant product ions generated by collision-induced dissociation are identified in TABLE TWO. B, total lipid extracts were prepared from packed red cell and plasma fractions of venous blood and directly analyzed by HPLC ESI MS/MS.
FIGURE 7
FIGURE 7. Structural analysis of nitrohydroxy fatty acid adducts in urine
The presence of nitrohydroxy fatty acids in urine was confirmed using HPLC ESI MS/MS in the negative ion mode by performing product ion analyses concurrent to MRM detection. Structures of possible adducts are presented along with their diagnostic fragments and product ion spectra for 18:1(OH)-NO2 (A), 18:2(OH)-NO2 (B), and 18:3(OH)-NO2 (C). Some regions of the MS/MS fragmentation patterns are amplified, as indicated, to better convey structural information. The 10-nitro regioisomer of 18:1(OH)-NO2 is present in urine, as evidenced by the intense peak corresponding to m/z 171; also present are fragments consistent with the 9-nitro regioisomer (m/z 202), loss of a nitro group (m/z 297), and water (m/z 326). 18:2(OH)-NO2 also shows a predominant m/z 171 fragment, again consistent with an oxidation product of LNO2 nitrated at the 10-carbon (B). Diagnostic fragments for the three other potential regioisomers were not apparent. Finally, multiple regioisomers of 18:3(OH)-NO2 are present (C).
FIGURE 8
FIGURE 8. Nitration of oleic acid by inflammatory oxidants
The potential nitration of the monounsaturated oleic acid by oxidants generated in an inflammatory milieu was explored by reaction with MPO, H2O2, and NO2; acidified NO2, pH 4.0; and peroxynitrite (ONOO). Each candidate nitrating condition included a negative control, as indicated. After reactions, lipids were extracted and analyzed for oleic acid nitration. Top panel, nitration reactions using MPO, acidic nitration, and ONOO all resulted in significant extents of oleic acid nitration as compared with matched controls. Significance of difference between treated and control groups was determined using a one-tailed, paired Students t test, with p < 0.05 and indicated by *. Middle panel, by monitoring the MRM transition m/z 344/202, the generation of nitrohydroxy C-9 OA-NO2 was measured. Due to the lack of corresponding 13C internal standards, quantitative determinations were precluded, thus data were expressed as the peak ion intensity of C-9 OA(OH)-NO2 generated as a proportion of added [13C18]OA-NO2. All three reaction conditions generated the C-9 nitrohydroxy adduct and appeared to do so at greater levels than control conditions. Bottom panel, the MRM transition m/z 342/171 was monitored to detect the formation of C-10 OA(OH)-NO2. Greater peak intensities for each reaction condition suggests that the C-10 nitrated oleic acid is the predominant nitroalkene product of these reactions.
FIGURE 9
FIGURE 9. OA-NO2 is a PPARγ agonist
A, CV-1 cells transiently co-transfected with a plasmid containing the luciferase gene under the control of three tandem PPRE (PPRE × 3 TK-luciferase) and hPPARγ, hPPARα, or hPPARδ expression plasmids showed all three PPARs were activated by OA-NO2, with the relative activation of PPARγ > PPARδ > PPARα. All values are expressed as mean ± S.D. (n = 3). PPARγ activation was significantly different from vehicle at 100 nM OA-NO2, whereas PPARα and PPARδ activation were significantly different from vehicle at 300 nM and 1 μM OA-NO2, respectively (*, p ≤ 0.05; Student’s t test). B, nitrated oleic acid was more potent than LNO2 in the activation of PPARγ, with 1 μM OA-NO2 inducing a degree of PPARγ activation that was similar to that induced by 3 μM LNO2 versus control (*, p ≤ 0.05; Student’s t test). Nitroalkene activation of PPARγ was partially blocked by the PPARγ antagonist GW9662 (#, p ≤ 0.05; Student’s t test).
FIGURE 10
FIGURE 10. OA-NO2 induces adipogenesis in 3T3-L1 preadipocytes
3T3-L1 preadipocytes were treated with OA-NO2, LNO2, rosiglitazone, and controls (oleic acid, and dimethyl sulfoxide (DMSO)) for 2 weeks. A, adipocyte differentiation was assessed both morphologically and via oil red O staining. Vehicle and oleic acid did not induce adipogenesis, whereas OA-NO2 (3 μM) induced ~60% of 3T3-L1 preadiopcyte differentiation; LNO2 (3 μM) induced ~30% of preadipocytes to differentiate, reflecting the greater potency of OA-NO2. B, OA-NO2- and rosiglitazone-induced preadipocyte differentiation resulted in the expression of adipocyte-specific markers (PPARγ2 and aP2), a response not detected for oleic acid.
FIGURE 11
FIGURE 11. OA-NO2 induces [3H]2-deoxy-D-glucose uptake in differentiated 3T3-L1 adipocytes
A, 3T3-L1 preadipocytes were differentiated to adipocytes and treated with OA-NO2 or LNO2 for 2 days prior to addition of [3H]2-deoxy-D-glucose. OA-NO2 (1 μM) induced significant increases in glucose uptake, with this effect paralleled by LNO2 (3 μM; p ≤ 0.05; Student’s t test). B, the increased adipocyte glucose uptake induced by nitroalkenes and the positive control rosiglitazone were significantly inhibited by the PPARγ-specific antagonist GW9662 (p ≤ 0.05; Student’s t test). All values are expressed as mean ± S.D. (n = 3).

References

    1. Smith WL. Am J Physiol. 1992;263:F181–F191. - PubMed
    1. Montuschi P, Barnes PJ, Roberts LJ. FASEB J. 2004;18:1791–1800. - PubMed
    1. Rubbo H, Radi R, Trujillo M, Telleri R, Kalyanaraman B, Barnes S, Kirk M, Freeman BA. J Biol Chem. 1994;269:26066–26075. - PubMed
    1. Schopfer FJ, Baker PR, Freeman BA. Trends Biochem Sci. 2003;28:646–654. - PubMed
    1. Marshall HE, Merchant K, Stamler JS. FASEB J. 2000;14:1889–1900. - PubMed

Publication types

MeSH terms