Comparative Study
. 2005 Oct 17:5:55.
doi: 10.1186/1471-2148-5-55.

Evolutionary, structural and functional relationships revealed by comparative analysis of syntenic genes in Rhizobiales

Affiliations
Comparative Study

Evolutionary, structural and functional relationships revealed by comparative analysis of syntenic genes in Rhizobiales

Gabriela Guerrero et al. BMC Evol Biol. .

Abstract

Background: Comparative genomics has provided valuable insights into the nature of gene sequence variation and chromosomal organization of closely related bacterial species. However, questions about the biological significance of gene order conservation, or synteny, remain open. Moreover, few comprehensive studies have been reported for rhizobial genomes.

Results: We analyzed the genomic sequences of four fast growing Rhizobiales (Sinorhizobium meliloti, Agrobacterium tumefaciens, Mesorhizobium loti and Brucella melitensis). We made a comprehensive gene classification to define chromosomal orthologs, genes with homologs in other replicons such as plasmids, and those which were species-specific. About two thousand genes were predicted to be orthologs in each chromosome and about 80% of these were syntenic. A striking gene colinearity was found in pairs of organisms and a large fraction of the microsyntenic regions and operons were similar. Syntenic products showed higher identity levels than non-syntenic ones, suggesting a resistance to sequence variation due to functional constraints; also, an unusually high fraction of syntenic products contained membranal segments. Syntenic genes encode a high proportion of essential cell functions, presented a high level of functional relationships and a very low horizontal gene transfer rate. The sequence variability of the proteins can be considered the species signature in response to specific niche adaptation. Comparatively, an analysis with genomes of Enterobacteriales showed a different gene organization but gave similar results in the synteny conservation, essential role of syntenic genes and higher functional linkage among the genes of the microsyntenic regions.

Conclusion: Syntenic bacterial genes represent a commonly evolved group. They not only reveal the core chromosomal segments present in the last common ancestor and determine the metabolic characteristics shared by these microorganisms, but also show resistance to sequence variation and rearrangement, possibly due to their essential character. In Rhizobiales and Enterobacteriales, syntenic genes encode a high proportion of essential cell functions and presented a high level of functional relationships.


Figures
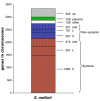
Figure 1
Figure 1
Schematic representation of the S. meliloti chromosome (compared with A. tumefaciens) according to the classification of predicted orthologs and homologs. Striped bars in red, from the bottom to the top: genes syntenic with the A. tumefaciens circular chromosome (denoted with C); syntenic with the A. tumefaciens linear chromosome (L); syntenic with the rest of Rhizobiales (rest). Striped bars in blue, from the bottom to the top: genes non-syntenic with the A. tumefaciens circular chromosome (C); non-syntenic with A. tumefaciens linear chromosome (L); non-syntenic with the rest of Rhizobiales (rest). White bar, homologs in other Rhizobiales chromosomes matched with unidirectional best hits (other). Green bar, homologs in plasmids (plasmid). Gray bar, species-specific genes (sp). Numbers indicate genes in each of the categories.
Figure 2
Figure 2
Synteny histogram of the S. meliloti chromosome in comparison to A. tumefaciens chromosomes. Red bars, syntenic genes. Framed with yellow boxes, microsyntenic regions with the A. tumefaciens (At) circular chromosome. Framed with light green boxes, microsyntenic regions with the At linear chromosome. Microsyntenic regions are denoted by letters (and numbers) in progressive order. Dark blue bars, non-syntenic genes with the At circular chromosome. Light blue bars, non-syntenic genes with the At linear chromosome. Green bars, homologs in plasmids. Gray bars, species-specific genes. White bars, homologs with other Rhizobiales chromosomes. Direction of transcription is denoted by upper (plus) or lower (minus) positions in respect to the central line. Predicted operons are denoted by red arrows. Scale in bp.
Figure 3
Figure 3
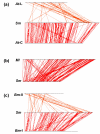
Schematic rearrangement of microsyntenic regions among S. meliloti, A. tumefaciens, M. loti and B. melitensis chromosomes. Panels: (a), S. meliloti chromosome (middle line) compared with A. tumefaciens circular (bottom line) and linear (upper line) chromosomes. (b), S. meliloti chromosome (lower line) compared with M. loti (upper line) chromosome. The M. loti chromosome was segmented in two fragments to maximize colinearity (see Methods). (c), S. meliloti chromosome (middle line) compared with B. melitensis chromosome I (bottom line), and II (upper line). oriC of Bm I was inverted to obtain maximal colinearity (see Methods). Red lines (orange for At-L and Bm-II chromosomes) represent the initial positions of the microsyntenic regions in each of the species analyzed.
Figure 4
Figure 4
Codon richness index (CRI) for rhizobial genomes. All gene classifications were based on comparisons against S. meliloti, unless explicitly stated otherwise. Panels: (a), S. meliloti (compared with A. tumefaciens). (b), A. tumefaciens. (c), M. loti. (d), B. melitensis. CRIs were calculated according to the method described by Medrano-Soto et al. [27]. Symbols: red circles, syntenic genes. Blue plus signs, non-syntenic. Green squares, homologs in plasmids. Gray crosses, species-specific genes. Horizontal lines denote the species-specific thresholds for low and high CRI.
Figure 5
Figure 5
Sequence identity distribution of chromosomal predicted orthologs. Panels: (a), syntenic and non-syntenic products from the S. meliloti-A. tumefaciens (both chromosomes) comparison. Y-axis, relative proportions. (b), syntenic and non-syntenic products from the E. coli-S. typhimurium comparison. Y-axis, number of proteins in each range. (c), syntenic and non-syntenic products from the S. meliloti-E. coli comparison. Y-axis, relative proportions. Red bars, syntenic products. Blue bars, non-syntenic products.
Figure 6
Figure 6
Sequence identity analysis of common syntenic genes. Panels: (a), in the four Rhizobiales. Comparisons: Red dots, S. meliloti-A tumefaciens. Green dots, S. meliloti-B. melitensis. (b), in Rhizobiales and Enterobacteriales. Comparisons: Red dots, S. meliloti-A tumefaciens. Green dots, S. meliloti-B. melitensis. Magenta dots, E. coli-S. meliloti. Blue dots, E coli-S. typhimurium. Reference line (in black) is the identity percentage of S. meliloti-M. loti syntenic genes in progressive order.
Figure 7
Figure 7
Theoretical isoelectric points (pI) of the S. meliloti-A. tumefaciens syntenic products. Dots represent translated products. Red dots, products on the diagonal. Yellow, dots, sector I. Brown dots, sector II. Green dots, sector III. Blue dots, sector IV (see Results). Scales in pH units.
Figure 8
Figure 8
Coverage of fuctional classes with syntenic and non-syntenic genes in the S. meliloti-A. tumefaciens comparison. X-axis, functional classes: 1) Transcription, 2) Translation, 3) Fatty acid and phospholipid metabolism, 4) Cell envelope, 5) Biosynthesis of cofactors, prosthetic groups and carriers, 6) Purine, pyrimidine, nucleoside and nucleotide metabolism, 7) DNA metabolism, 8) Amino acid metabolism, 9) Cellular processes, 10) Energy metabolism, 11) Transport and ATP binding proteins, 12) Regulatory functions, 13) Central intermediary metabolism. Red bars, lower fraction: syntenic genes in the four Rhizobiales; upper fraction, syntenic genes in the S. meliloti-A. tumefaciens comparison. Blue bars, lower fraction: non-syntenic genes in the four Rhizobiales; upper fraction: non-syntenic genes in the Sm-At comparison. Y-axis, % of coverage.
Figure 9
Figure 9
Distribution of syntenic genes (in regions) by functional superclasses in the S. meliloti chromosome. Blue squares, informational processes. Red triangles, cellular processes. Green diamonds, operational functions. For distribution only microsyntenic regions (from the S. meliloti-A. tumefaciens comparison) with at least two genes belonging to a given class were considered.

References

    1. Genomes Online Database http://www.genomesonline.org
    1. Itoh T, Martin W, Nei M. Acceleration of genomic evolution caused by enhanced mutation rate in endocellular symbionts. Proc Natl Acad Sci U S A. 2002;99:12944–12948. doi: 10.1073/pnas.192449699. - DOI - PMC - PubMed
    1. Jordan IK, Rogozin IB, Wolf YI, Koonin EV. Microevolutionary Genomics of Bacteria. Theoretical Population Biology. 2002;61:435. doi: 10.1006/tpbi.2002.1588. - DOI - PubMed
    1. Rocha EP. Order and disorder in bacterial genomes. Curr Opin Microbiol. 2004;7:519–527. doi: 10.1016/j.mib.2004.08.006. - DOI - PubMed
    1. Korbel JO, Jensen LJ, von Mering C, Bork P. Analysis of genomic context: prediction of functional associations from conserved bidirectionally transcribed gene pairs. Nat Biotechnol. 2004;22:911–917. doi: 10.1038/nbt988. - DOI - PubMed

Publication types

MeSH terms

LinkOut - more resources