Comparative Study
. 2005 Oct 17;202(8):1087-98.
doi: 10.1084/jem.20042530.

Chemokine receptor CCR5 promotes leukocyte trafficking to the brain and survival in West Nile virus infection

Affiliations
Comparative Study

Chemokine receptor CCR5 promotes leukocyte trafficking to the brain and survival in West Nile virus infection

William G Glass et al. J Exp Med. .

Abstract

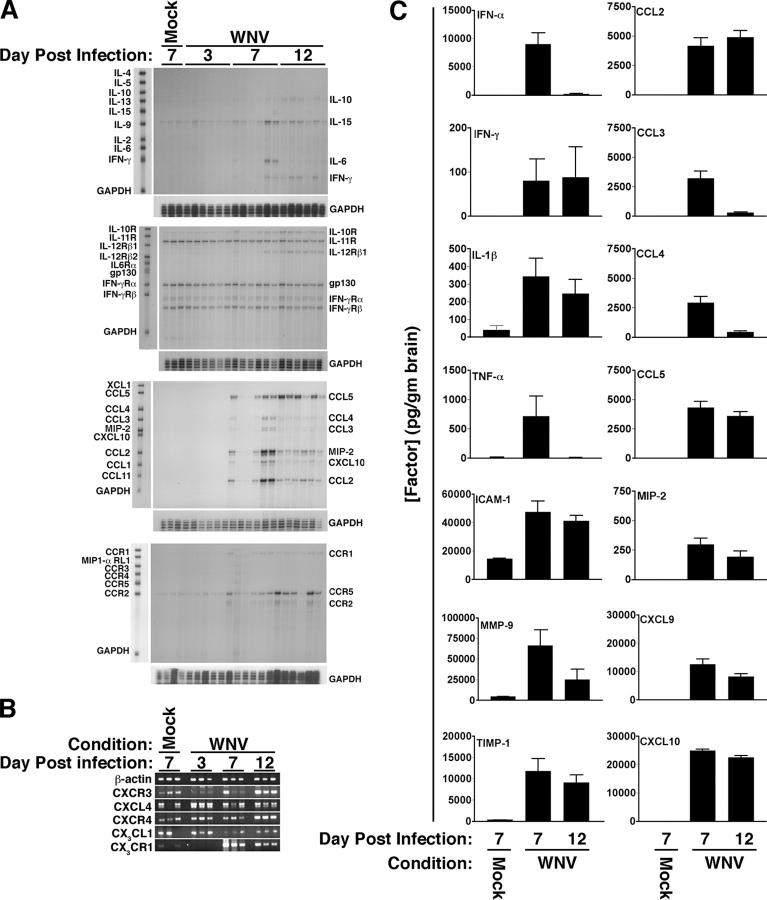
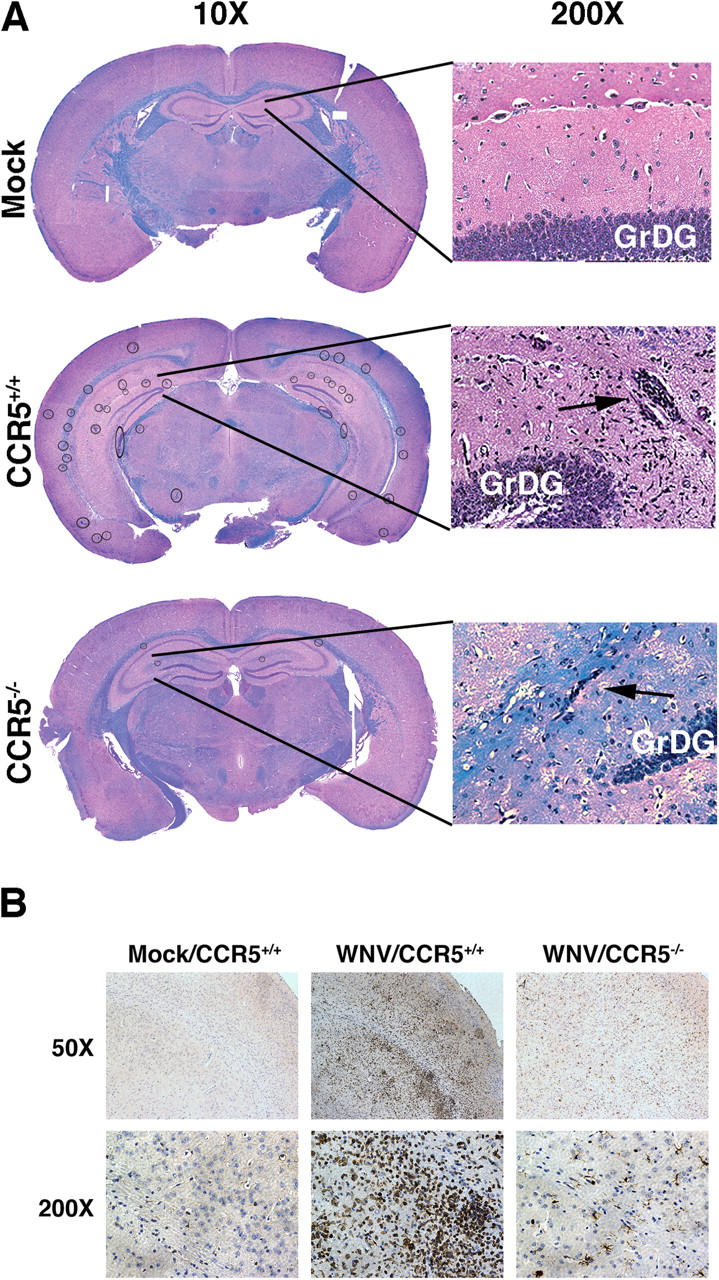
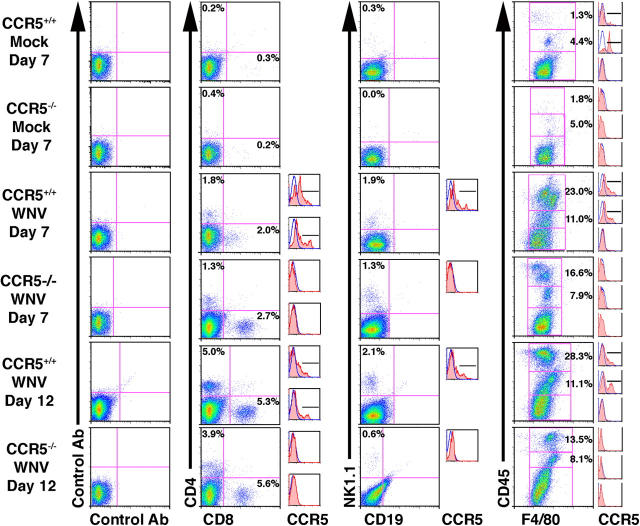
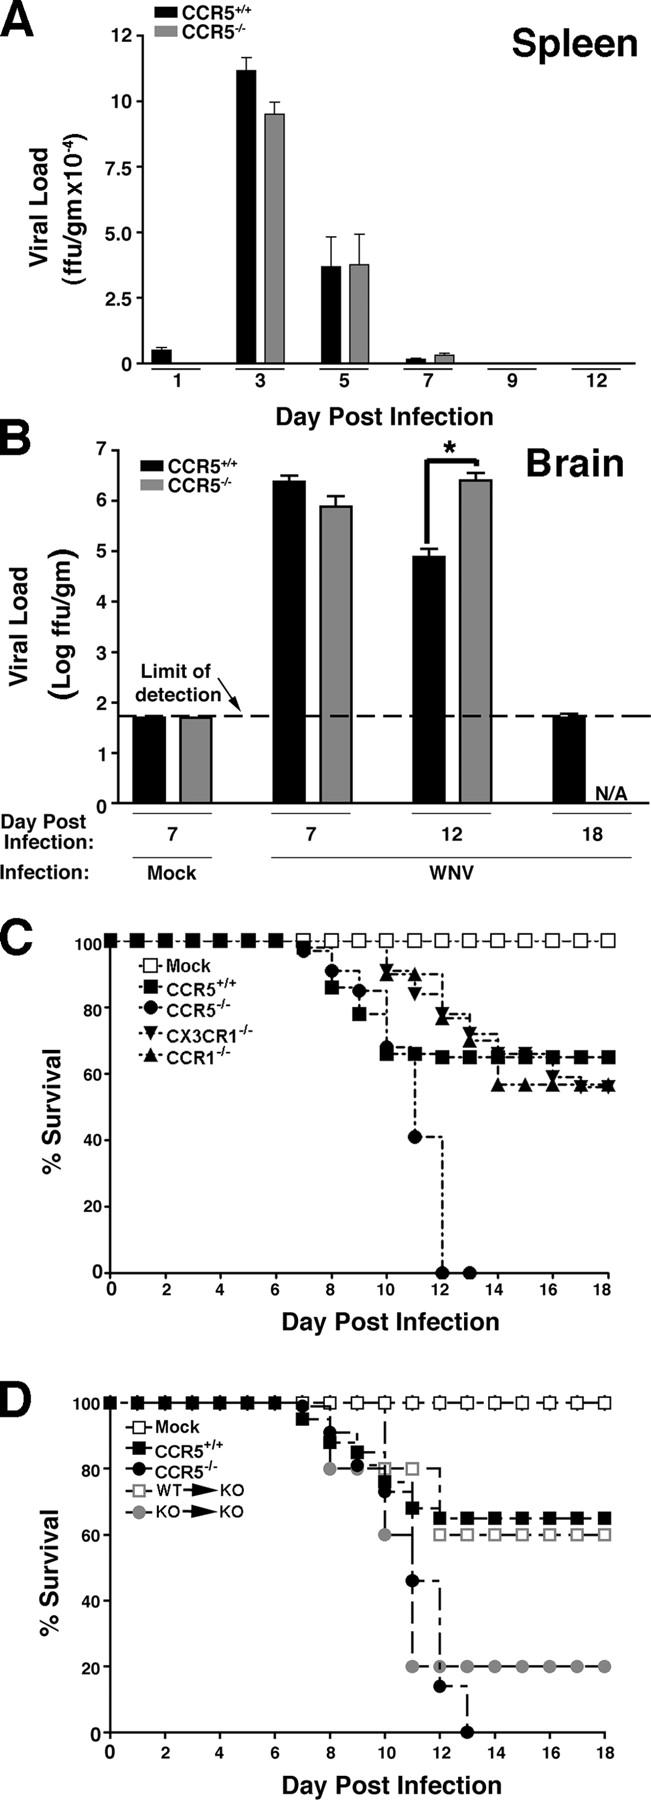
The molecular immunopathogenesis of West Nile virus (WNV) infection is poorly understood. Here, we characterize a mouse model for WNV using a subcutaneous route of infection and delineate leukocyte subsets and immunoregulatory factors present in the brains of infected mice. Central nervous system (CNS) expression of the chemokine receptor CCR5 and its ligand CCL5 was prominently up-regulated by WNV, and this was associated with CNS infiltration of CD4+ and CD8+ T cells, NK1.1+ cells and macrophages expressing the receptor. The significance of CCR5 in pathogenesis was established by mortality studies in which infection of CCR5-/- mice was rapidly and uniformly fatal. In the brain, WNV-infected CCR5-/- mice had increased viral burden but markedly reduced NK1.1+ cells, macrophages, and CD4+ and CD8+ T cells compared with WNV-infected CCR5+/+ mice. Adoptive transfer of splenocytes from WNV-infected CCR5+/+ mice into infected CCR5-/- mice increased leukocyte accumulation in the CNS compared with transfer of splenocytes from infected CCR5-/- mice into infected CCR5-/- mice, and increased survival to 60%, the same as in infected CCR5+/+ control mice. We conclude that CCR5 is a critical antiviral and survival determinant in WNV infection of mice that acts by regulating trafficking of leukocytes to the infected brain.


Figures

Figure 1.
Figure 1.
West Nile virus induces production of specific immunoregulatory factors in the brains of C57BL/6 mice. (A) RNA analysis by RPA. Leftmost lane in each of the four panels is unprotected probe, and the factors analyzed are named to the left; note that the protected fragments run slightly lower on gel. The names of factors scoring positive in the assay are given to the right of each band. GAPDH is provided as an RNA loading control. Time after infection (days), is indicated at the top of each panel. Mock-infected mice were analyzed on day 7 of the experiment. Each lane on each panel corresponds to RNA from a single mouse brain. The results shown are from two independent experiments with six mice analyzed for each time point, except for mock-infected mice (n = 3). Lanes corresponding in location on each of the four gels represent RNA from the same mouse. (B) RNA analysis by RT-PCR. β-Actin is provided as a loading control. Mock-infected mice were analyzed at day 7. Each lane represents a single mouse. (C) Protein analysis. The factor analyzed is identified at the top left of each graph. Time and virus variables for each factor are specified at the bottom of the panel. Data were pooled from three experiments with three to five in each group, and are presented as mean ± SEM pg/g protein in supernatants from total brain homogenates as a function of time after infection.
Figure 2.
Figure 2.
West Nile virus induces multifocal encephalitis in C57BL/6 mice. (A) Histologic analysis. Brains of mock- and WNV-infected CCR5+/+ and CCR5−/− mice harvested at day 12 after infection were fixed in formalin and embedded in paraffin. Coronal sections 6-μm thick were stained with hematoxylin and eosin to visualize cells and luxol fast blue to stain myelin tracts blue. Multiple cellular infiltrates were observed in the infected mice (circled in the 10× image). Typical infiltrates are shown at higher magnification in the hippocampus (arrows). GrDG, granule cell layer of the dentate gyrus. (B) Immunohistochemical analysis. Brain sections, prepared as in A from mock- and WNV-infected mice with the indicated CCR5 genotype, were stained with methyl green and anti–human CD3 mAb. Representative sections of the cortex are shown. CD3+ cells stain brown. Images in A and B are representative of five mock-infected brains, nine WNV-infected CCR5+/+ brains, and six WNV-infected CCR5−/− brains.
Figure 3.
Figure 3.
WNV induces accumulation of leukocytes in mouse brain. Representative FACS analysis dot plots of mock- and WNV-infected CCR5+/+ and CCR5−/− mice. Percentages are calculated based on total events; histograms to the right of the corresponding dot plot show CCR5 staining within single positive CD4+ or CD8+ T cells, NK cells, and the three F4/80+/CD45+ subsets. The blue line in the histogram represents isotype control staining, and the red shaded line represents CCR5 staining. Bar shows which portion of the histogram was considered CCR5 positive.
Figure 4.
Figure 4.
CCR5 regulates accumulation of T cells, NK cells, and macrophages in the WNV-infected mouse brain. (A) WNV induces accumulation of CCR5+ leukocytes in the mouse brain. CCR5 surface expression was examined on specific leukocyte subsets isolated from mouse brain and the percent positive cells was determined. (B and C) Lack of CCR5 blunts leukocyte accumulation in the mouse brain in response to WNV infection. Data were pooled from three experiments, with three to five mice analyzed at each time point/experiment and are presented as the mean ± SEM. *, P < 0.04 for the indicated comparison by Student's t test.
Figure 5.
Figure 5.
CCR5 deficiency affects immune responses to WNV selectively in the brain. (A) Serum cytokine analysis. The factor analyzed is identified at the bottom of the graph. Data were pooled from two experiments with five to seven mice in each group, and are presented as mean ± SEM pg/ml serum as a function of time after infection. (B and C) Intracellular cytokine staining for WNV-induced IFN-γ. Splenocytes were isolated from mice at the indicated days after WNV infection and assayed without exogenous stimulation (B) or after 4 h of stimulation with ionomycin and PMA (C). Data presented are from one experiment with five mice at each time point. Values at the top of each bar are the percentage of total cells represented by the indicated cell type. (D) Adoptive transfer of CCR5+/+ and CCR5−/− splenocytes from WNV-infected mice into WNV-infected CCR5−/− mice. Infected CCR5−/− recipient mice, designated (WT → KO) and (KO → KO) received splenocytes from infected CCR5+/+ or infected CCR5−/− donor mice, respectively, 4 d after s.c. infection. FACS analysis was performed 4 d after transfer (8 d after infection). Data are presented as the mean ± SEM and are from one experiment with five mice in each group. (B and C) Percents shown are the percentage of total cells. *, P < 0.02 for the indicated comparison (of total cell number) by Student's t test.
Figure 6.
Figure 6.
West Nile virus infection is uniformly fatal in CCR5 knockout mice. (A) Time course of viral clearance from spleen. Virus was quantified in the spleens of the indicated strains of surviving mice at the indicated times by focus formation assay. Mock-infected mice were analyzed on day 7 of the experiment. (B) Time course of viral clearance from brain. Virus was quantified in the brain of the indicated strains of mice at the indicated times by focus formation assay. Data were pooled from three to four experiments with three to five mice at each time point indicated and are presented as the mean ± SEM. *, P < 0.02 for the indicated comparison by Student's t test. N/A, not applicable, because all infected CCR5−/− die by day 13. (C) Kaplan-Meier analysis of survival of WNV-infected mice. Results shown are pooled data from three independent experiments for CCR5+/+ mice (n = 50 total mice) and CCR5−/− mice (n = 34), and two independent experiments for CCR1−/− mice (n = 30) and CX3CR1−/− mice (n = 32). Similar results were obtained for both wild-type C57BL6/J and C57BL/6NTac control mice; however, only the C57BL6/J results are shown (CCR5+/+). (D) Kaplan-Meier analysis of survival of adoptive transfer mice. WT → KO, transfer of splenocytes from WNV-infected CCR5+/+ mice into WNV-infected CCR5−/− mice; KO → KO, transfer of splenocytes from WNV-infected CCR5−/− mice to WNV-infected CCR5−/− mice. The following control groups were included that did not undergo adoptive transfer: Mock, mock-infected CCR5+/+mice; CCR5+/+, WNV-infected CCR5+/+ mice; and CCR5−/−, WNV-infected CCR5−/− mice. Data represent a single experiment with 10 mice in each group.

References

    1. Smithburn, K.C., T.P. Hughes, A.W. Burke, and J.H. Paul. 1940. Neurotropic virus isolated from the blood of a native of Uganda. Am. J. Trop. Med. 20:471–472.
    1. Hubalek, Z., and J. Halouzka. 1999. West Nile fever–a reemerging mosquito-borne viral disease in Europe. Emerg. Infect. Dis. 5:643–650. - PMC - PubMed
    1. Lanciotti, R.S., J.T. Roehrig, V. Deubel, J. Smith, M. Parker, K. Steele, B. Crise, K.E. Volpe, M.B. Crabtree, J.H. Scherret, et al. 1999. Origin of the West Nile virus responsible for an outbreak of encephalitis in the northeastern United States. Science. 286:2333–2337. - PubMed
    1. Centers for Disease Control and Prevention. 2004. West Nile virus activity–United States, October 6-12, 2004. MMWR Morb. Mortal. Wkly. Rep. 53:950–951. - PubMed
    1. van der Poel, W.H. 1999. West Nile-like virus is the cause of encephalitis in humans and horses and the death of hundreds of birds in New York. [In Dutch.] Tijdschr. Diergeneeskd. 124:704–705 - PubMed

Publication types

MeSH terms