

Audiometric predictions using stimulus-frequency otoacoustic emissions and middle ear measurements
- PMID: 16230898
- PMCID: PMC1768344
- DOI: 10.1097/01.aud.0000179692.81851.3b
Audiometric predictions using stimulus-frequency otoacoustic emissions and middle ear measurements
Abstract
Objective: The goals of the study are to determine how well stimulus-frequency otoacoustic emissions (SFOAEs) identify hearing loss, classify hearing loss as mild or moderate-severe, and correlate with pure-tone thresholds in a population of adults with normal middle ear function. Other goals are to determine if middle ear function as assessed by wideband acoustic transfer function (ATF) measurements in the ear canal account for the variability in normal thresholds, and if the inclusion of ATFs improves the ability of SFOAEs to identify hearing loss and predict pure-tone thresholds.
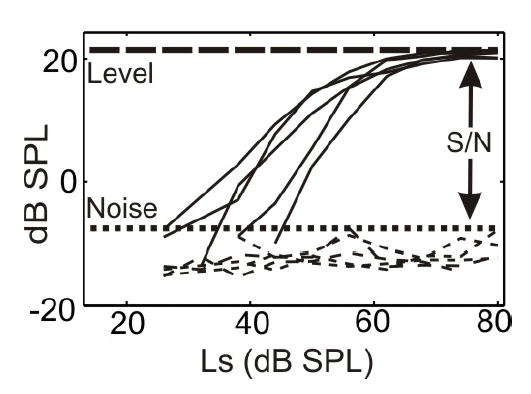
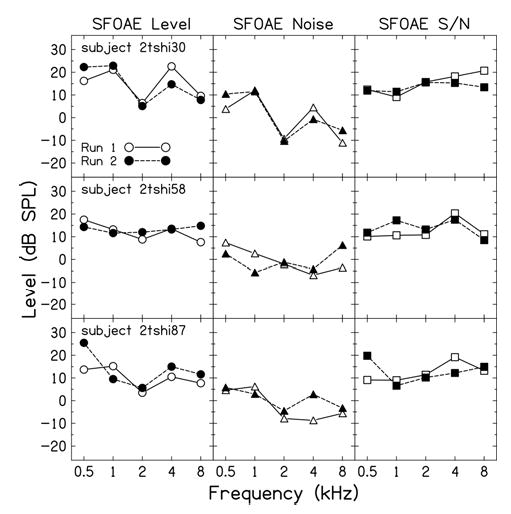
Design: The total suppressed SFOAE signal and its corresponding noise were recorded in 85 ears (22 normal ears and 63 ears with sensorineural hearing loss) at octave frequencies from 0.5 to 8 kHz, using a nonlinear residual method. SFOAEs were recorded a second time in three impaired ears to assess repeatability. Ambient-pressure ATFs were obtained in all but one of these 85 ears and were also obtained from an additional 31 normal-hearing subjects in whom SFOAE data were not obtained. Pure-tone air and bone conduction thresholds and 226-Hz tympanograms were obtained on all subjects. Normal tympanometry and the absence of air-bone gaps were used to screen subjects for normal middle ear function. Clinical decision theory was used to assess the performance of SFOAE and ATF predictors in classifying ears as normal or impaired, and linear regression analysis was used to test the ability of SFOAE and ATF variables to predict the air conduction audiogram.
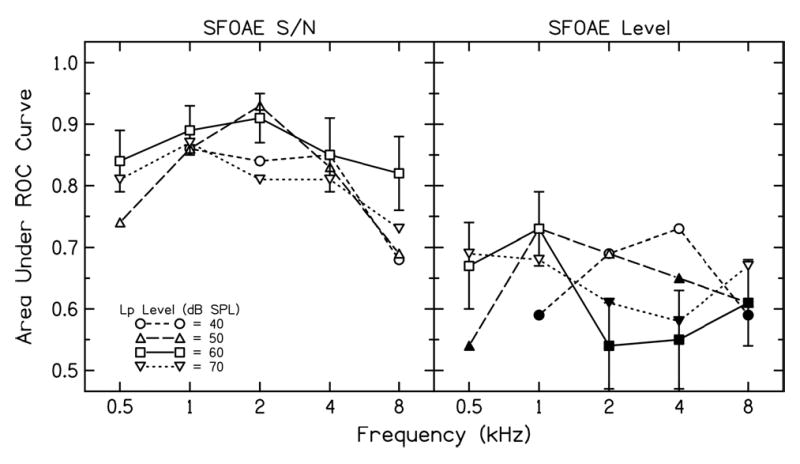
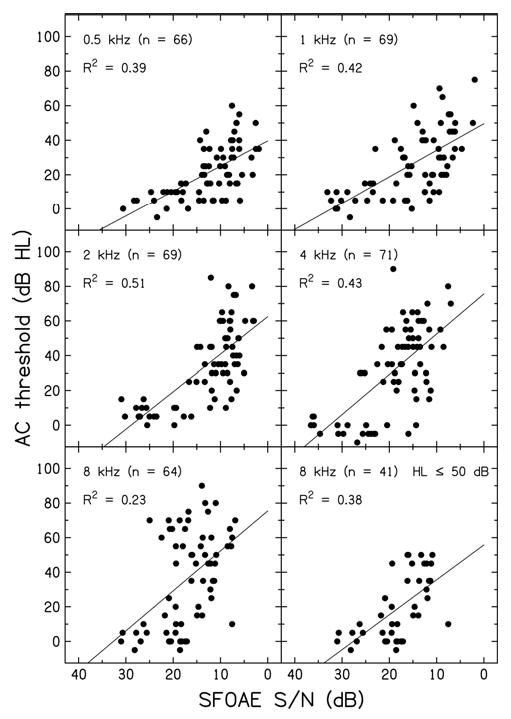
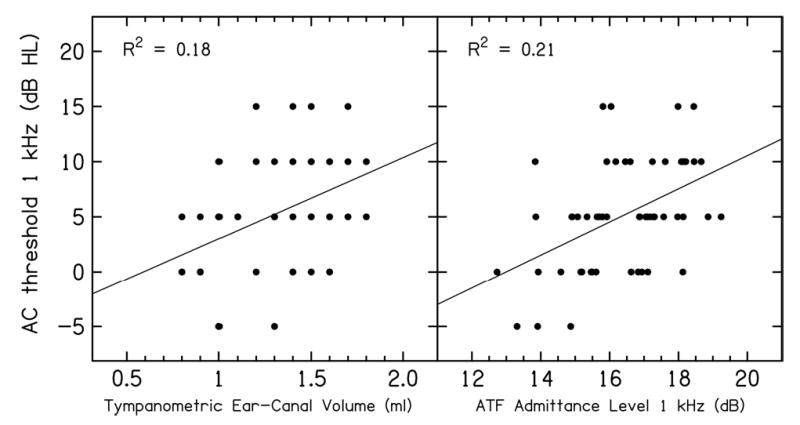
Results: The ability of SFOAEs to classify ears as normal or hearing impaired was significant at all test frequencies. The ability of SFOAEs to classify impaired ears as either mild or moderate-severe was significant at test frequencies from 0.5 to 4 kHz. SFOAEs were present in cases of severe hearing loss. SFOAEs were also significantly correlated with air conduction thresholds from 0.5 to 8 kHz. The best performance occurred with the use of the SFOAE signal-to-noise ratio as the predictor, and the overall best performance was at 2 kHz. The SFOAE signal-to-noise measures were repeatable to within 3.5 dB in impaired ears. The ATF measures explained up to 25% of the variance in the normal audiogram; however, ATF measures did not improve SFOAEs predictors of hearing loss except at 4 kHz.
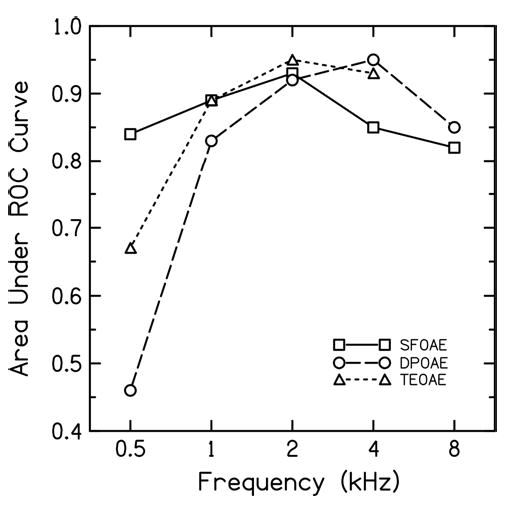
Conclusions: In common with other OAE types, SFOAEs are capable of identifying the presence of hearing loss. In particular, SFOAEs performed better than distortion-product and click-evoked OAEs in predicting auditory status at 0.5 kHz; SFOAE performance was similar to that of other OAE types at higher frequencies except for a slight performance reduction at 4 kHz. Because SFOAEs were detected in ears with mild to severe cases of hearing loss, they may also provide an estimate of the classification of hearing loss. Although SFOAEs were significantly correlated with hearing threshold, they do not appear to have clinical utility in predicting a specific behavioral threshold. Information on middle ear status as assessed by ATF measures offered minimal improvement in SFOAE predictions of auditory status in a population of normal and impaired ears with normal middle ear function. However, ATF variables did explain a significant fraction of the variability in the audiograms of normal ears, suggesting that audiometric thresholds in normal ears are partially constrained by middle ear function as assessed by ATF tests.
Figures

Similar articles
-
Chirp-Evoked Otoacoustic Emissions and Middle Ear Absorbance for Monitoring Ototoxicity in Cystic Fibrosis Patients.Ear Hear. 2018 Jan/Feb;39(1):69-84. doi: 10.1097/AUD.0000000000000464. Ear Hear. 2018. PMID: 28708814 Free PMC article.
-
[Effect of inner ear hearing loss on delayed otoacoustic emissions (TEOAE) and distortion products (DPOAE)].Laryngorhinootologie. 1996 Dec;75(12):709-18. doi: 10.1055/s-2007-997664. Laryngorhinootologie. 1996. PMID: 9081275 German.
-
Tone-burst and click-evoked otoacoustic emissions in subjects with hearing loss above 0.25, 0.5, and 1 kHz.Ear Hear. 2012 Nov-Dec;33(6):757-67. doi: 10.1097/AUD.0b013e31825c05ac. Ear Hear. 2012. PMID: 22710662
-
[Otoacoustic emissions, auditory evoked potentials, pure tone thresholds and speech intelligibility in cases of auditory neuropathy].HNO. 2000 Jan;48(1):28-32. doi: 10.1007/s001060050005. HNO. 2000. PMID: 10663046 Review. German.
-
A review of the perceptual effects of hearing loss for frequencies above 3 kHz.Int J Audiol. 2016 Dec;55(12):707-714. doi: 10.1080/14992027.2016.1204565. Epub 2016 Jul 14. Int J Audiol. 2016. PMID: 27414746 Review.
Cited by
-
Characterizing a Joint Reflection-Distortion OAE Profile in Humans With Endolymphatic Hydrops.Ear Hear. 2023 Nov-Dec 01;44(6):1437-1450. doi: 10.1097/AUD.0000000000001387. Epub 2023 Jul 14. Ear Hear. 2023. PMID: 37450653 Free PMC article.
-
Wideband absorbance tympanometry using pressure sweeps: system development and results on adults with normal hearing.J Acoust Soc Am. 2008 Dec;124(6):3708-19. doi: 10.1121/1.3001712. J Acoust Soc Am. 2008. PMID: 19206798 Free PMC article.
-
Characteristic of Stimulus Frequency Otoacoustic Emissions: Detection Rate, Musical Training Influence, and Gain Function.Brain Sci. 2019 Sep 26;9(10):255. doi: 10.3390/brainsci9100255. Brain Sci. 2019. PMID: 31561573 Free PMC article.
-
Specification of absorbed-sound power in the ear canal: application to suppression of stimulus frequency otoacoustic emissions.J Acoust Soc Am. 2011 Feb;129(2):779-91. doi: 10.1121/1.3531796. J Acoust Soc Am. 2011. PMID: 21361437 Free PMC article.
-
Tuning of SFOAEs Evoked by Low-Frequency Tones Is Not Compatible with Localized Emission Generation.J Assoc Res Otolaryngol. 2015 Jun;16(3):317-29. doi: 10.1007/s10162-015-0513-0. Epub 2015 Mar 27. J Assoc Res Otolaryngol. 2015. PMID: 25813430 Free PMC article.
References
-
- Avan P, Bonfils P, Loth D, Narcy Ph, Trotoux J. Quantitative assessment of human cochlear function by evoked otoacoustic emissions. Hear Res. 1991;52:99–112. - PubMed
-
- Brass D, Kemp DT. Suppression of stimulus frequency otoacoustic emissions. J Acoust Soc Am. 1993;93:920–939. - PubMed
-
- Dirks DD. Bone-conduction threshold testing. In: Katz J, editor. Handbook of clinical audiology. 4th ed. Baltimore: Williams & Wilkins; 1994. pp. 132–146.
-
- Delong ER, Delong DM, Clarke-Pearson DL. Comparing the areas under two or more correlated receiver operating curves: A nonparametric approach. Biometrics. 1988;44:837–845. - PubMed
Publication types
MeSH terms
Grants and funding
LinkOut - more resources
Full Text Sources
Miscellaneous
