. 2005 Nov;3(11):e371.
doi: 10.1371/journal.pbio.0030371. Epub 2005 Oct 25.

Wave-like spread of Ebola Zaire

Affiliations

Wave-like spread of Ebola Zaire

Peter D Walsh et al. PLoS Biol. 2005 Nov.

Abstract

In the past decade the Zaire strain of Ebola virus (ZEBOV) has emerged repeatedly into human populations in central Africa and caused massive die-offs of gorillas and chimpanzees. We tested the view that emergence events are independent and caused by ZEBOV variants that have been long resident at each locality. Phylogenetic analyses place the earliest known outbreak at Yambuku, Democratic Republic of Congo, very near to the root of the ZEBOV tree, suggesting that viruses causing all other known outbreaks evolved from a Yambuku-like virus after 1976. The tendency for earlier outbreaks to be directly ancestral to later outbreaks suggests that outbreaks are epidemiologically linked and may have occurred at the front of an advancing wave. While the ladder-like phylogenetic structure could also bear the signature of positive selection, our statistical power is too weak to reach a conclusion in this regard. Distances among outbreaks indicate a spread rate of about 50 km per year that remains consistent across spatial scales. Viral evolution is clocklike, and sequences show a high level of small-scale spatial structure. Genetic similarity decays with distance at roughly the same rate at all spatial scales. Our analyses suggest that ZEBOV has recently spread across the region rather than being long persistent at each outbreak locality. Controlling the impact of Ebola on wild apes and human populations may be more feasible than previously recognized.


Figures
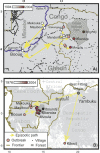
Figure 1
Figure 1. Maps of Ebola Zaire Outbreaks
(A) Human outbreak locations in Gabon and Congo as reported [2]. Also shown are October 2003 human outbreak at Mbandza village and April 2004 ape die-off around Iboundji (Lokoué) Clearing in Odzala National Park. Yellow arrows represent epizootic path suggested by phylogenetic analyses. (B) Sites of all primary outbreaks of Ebola Zaire in humans documented [2,14] and the epizootic path suggested by the spatio-temporal pattern of outbreaks (yellow arrows). Best fitting origin found through ML search for the spatial location that produced the strongest correlation between outbreak date and geographic distance from the origin. ML search based on the correlation between patristic genetic distance and spatial separation between outbreaks places the epizootic pivot point just southeast of Booué. In both figures, shading of circles is proportional to time after first outbreak in series.
Figure 2
Figure 2. ML Tree of Full-Length (> 2,000 bp) ZEBOV-GP Sequences
Tree was found in Paup* and rooted in a separate analysis using ICEBOV as an out-group. The latter analysis excluded a 576-bp variable region for which alignment with ZEBOV was uncertain (see Materials and Methods). Numbers next to branches indicate percent support based on 1,000 bootstrap replicates and posterior probabilities obtained in a molecular clock-based analysis in program BEAST (only values > 70% are shown).
Figure 3
Figure 3. Spatial Spread of ZEBOV
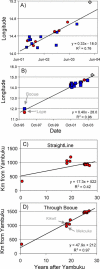
(A) Relationship between date and longitude of outbreaks in Gabon-Congo border area. Blue squares, human outbreaks [2] and 2003 outbreak at Mbandza village; red circles, animal carcasses testing positive for Ebola [18]; gray diamonds, ape die-off at Ibounji\Lokoue clearing. Regression line is for pooled data. Analyzed separately, human outbreaks and Ebola+ animal carcasses both show significant correlations between longitude and date (human outbreaks n = 12, R2 = 0.48, p = 0.01; animal carcasses n = 13, R2 = 0.91, p < 0.001). (B) Added are 1996 human outbreak at Booué and Ebola+ chimpanzee carcass from nearby Lope [1]. The lack of reported human outbreaks between 1996 and 2001 may simply reflect the extremely low village density between Booué and Mendemba (Figure 1). (C) Time after Yambuku versus straight line distance from Yambuku to all subsequent human outbreaks, including [2,14] and Mbandza village (R2 = 0.42, n = 17, p = 0.005). (D) Same as (C) but with distance from Yambuku to the recent Gabon-Congo border outbreaks measured as passing through Booué (R2 = 0.97,n =17, p < 0.001). All figures include outbreak sites cited [2,14] for which no ZEBOV-GP sequences were publicly available.
Figure 4
Figure 4. Correlation between Geographic Distance and Patristic Genetic Distance
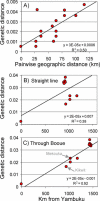
(A) ML genetic distances (substitutions per nucleotide site) plotted as function of geographic distance separating pairs of outbreak sites for the six full-length, georeferenced sequences sampled by Leroy et al. (R2 = 0.70, Mantel test p = 0.002). Makokou and Yembelengoye sequences excluded because of unknown spatial origin of case and partial sequence, respectively (Protocol S3). (B) Correlation between straight line distance from the initial ZEBOV outbreak site at Yambuku and patristic genetic distance to Yambuku for all available georeferenced, full-length sequences (R2 = 0.38 , n = 11, p = 0.040). (C) Same as (B) but with geographic distances to the recent Gabon-Congo border outbreaks measured as passing through Booué (R2 = 0.92 , n = 11, p < 0.001).
Figure 5
Figure 5. Epizootic Pivot Point
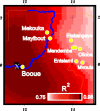
Shading of each grid cell indicates the strength of correlation (R2) between geographic distance and patristic genetic distance when that grid cell (rather than Booué) is used as the epizootic pivot point. The position of the best fitting pivot point (shown with a white X) along the Ogooue River (blue line) is consistent with a river crossing near Booué, with subsequent movement east toward the Mendemba area. It is not consistent with gene flow directly between the other mid-1990s outbreak localities (Mekouka and Mayibout) and Mendemba.
Figure 6
Figure 6. Spatial Spread from 2001–2005
Distance of each human outbreak site from the initial outbreak at Mendemba village, Gabon, plotted as a function of time after the Mendemba outbreak. Dashed regression line uses only outbreaks from 2001–2003 (R2 = 0.43, p = 0.04). Solid regression line includes May 2005 outbreak at Etoumbi village (R2 = 0.73, p < 0.001).

Similar articles

Cited by

References

    1. Georges AJ, Leroy EM, Renaut AA, Benissan CT, Nabias RJ, et al. Ebola hemorrhagic fever outbreaks in Gabon, 1994–1997: Epidemiologic and health control issues. J Infect Dis. 1999;179:S65–S75. - PubMed
    1. Leroy EM, Rouquet P, Formenty P, Souquiere S, Kilbourne A, et al. Multiple Ebola virus transmission events and rapid decline of central African wildlife. Science. 2004;303:387–390. - PubMed
    1. Huijbregts B, De Wachter P, Obiang LSN, Akou ME. Ebola and the decline of gorilla Gorilla gorilla and chimpanzee Pan troglodytes populations in Minkebe Forest, north-eastern Gabon. Oryx. 2003;37:437–443.
    1. Walsh PD, Abernethy KA, Bermejo M, Beyers R, De Wachter P, et al. Catastrophic ape decline in western equatorial Africa. Nature. 2003;422:611–614. - PubMed
    1. Tutin CEG, Fernandez M. Nationwide census of gorilla (Gorilla gorilla) and chimpanzee (Pan troglodytes) populations in Gabon. Am J Primatol. 1984;6:313–336. - PubMed

Publication types

MeSH terms