. 2005 Nov;3(11):e356.
doi: 10.1371/journal.pbio.0030356. Epub 2005 Oct 25.

Modeling T cell antigen discrimination based on feedback control of digital ERK responses

Affiliations

Modeling T cell antigen discrimination based on feedback control of digital ERK responses

Grégoire Altan-Bonnet et al. PLoS Biol. 2005 Nov.

Abstract

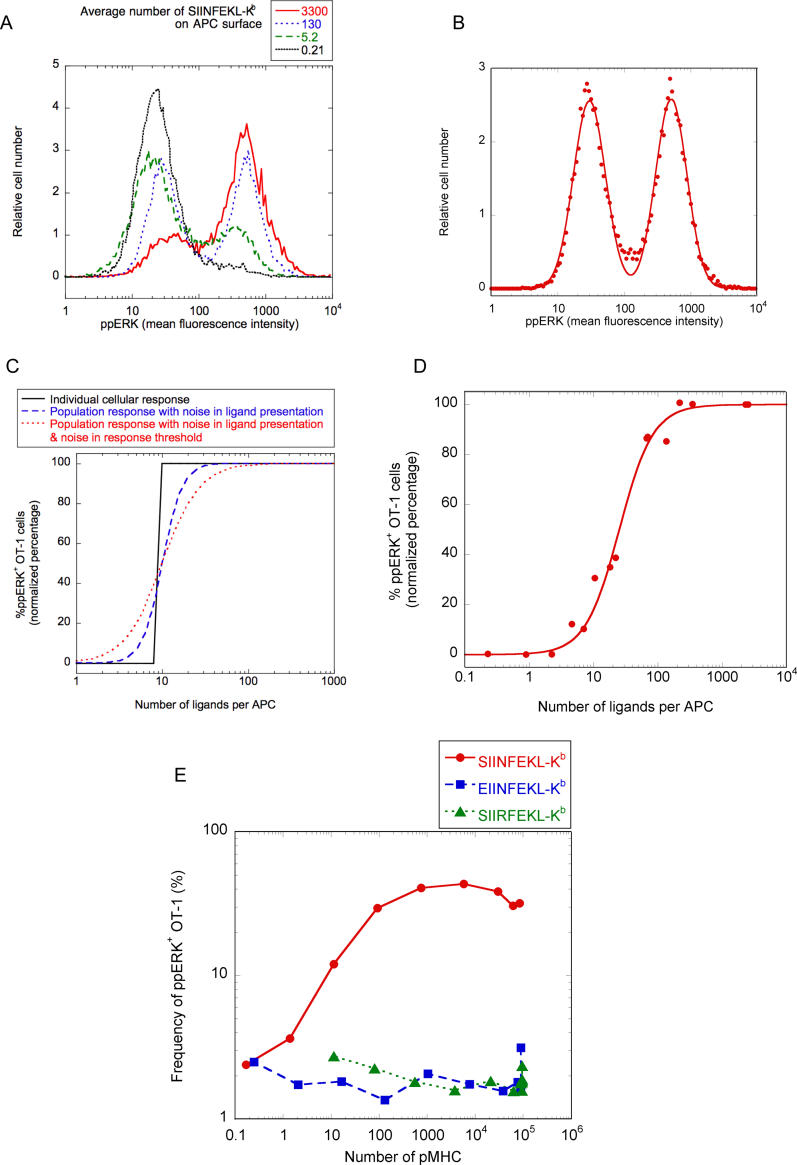
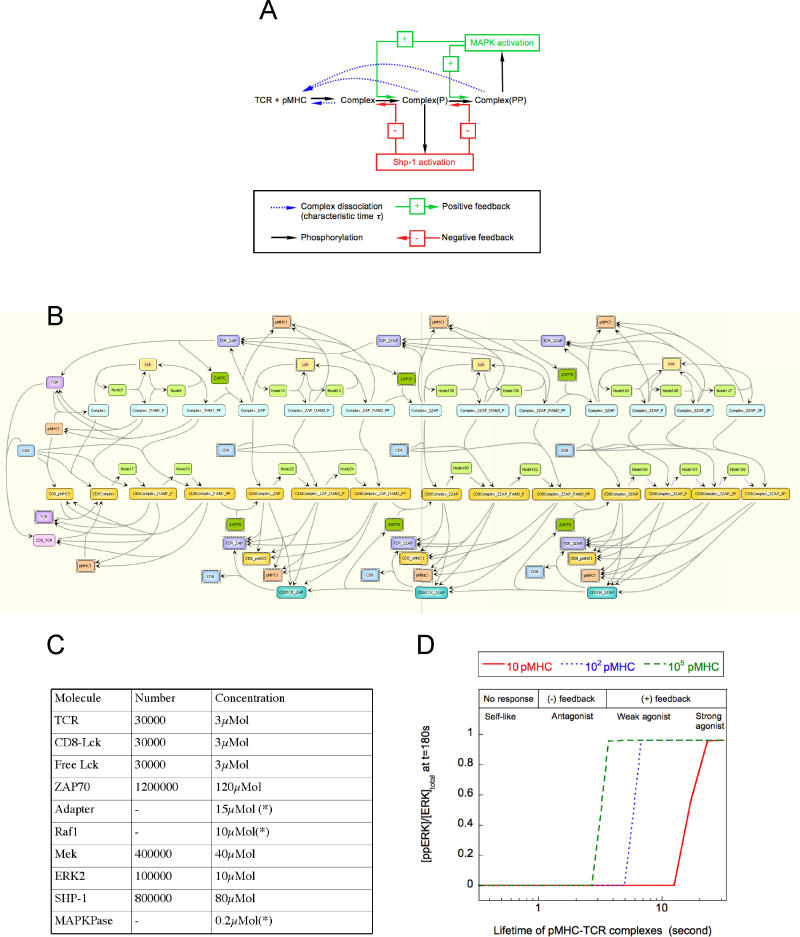
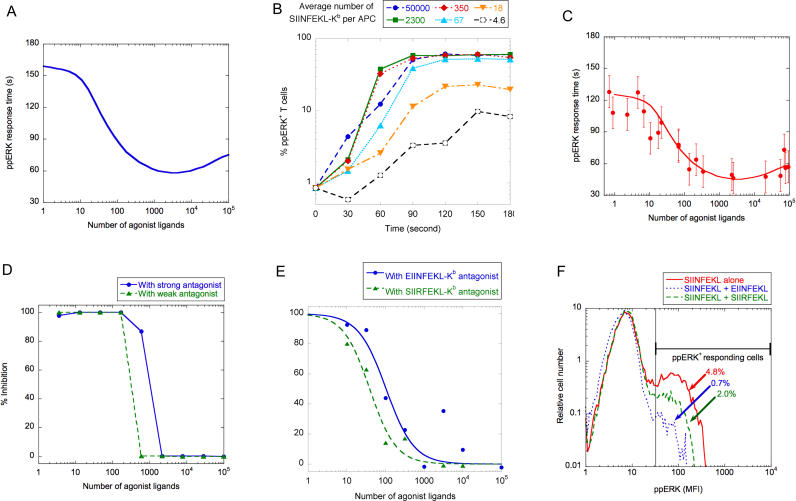
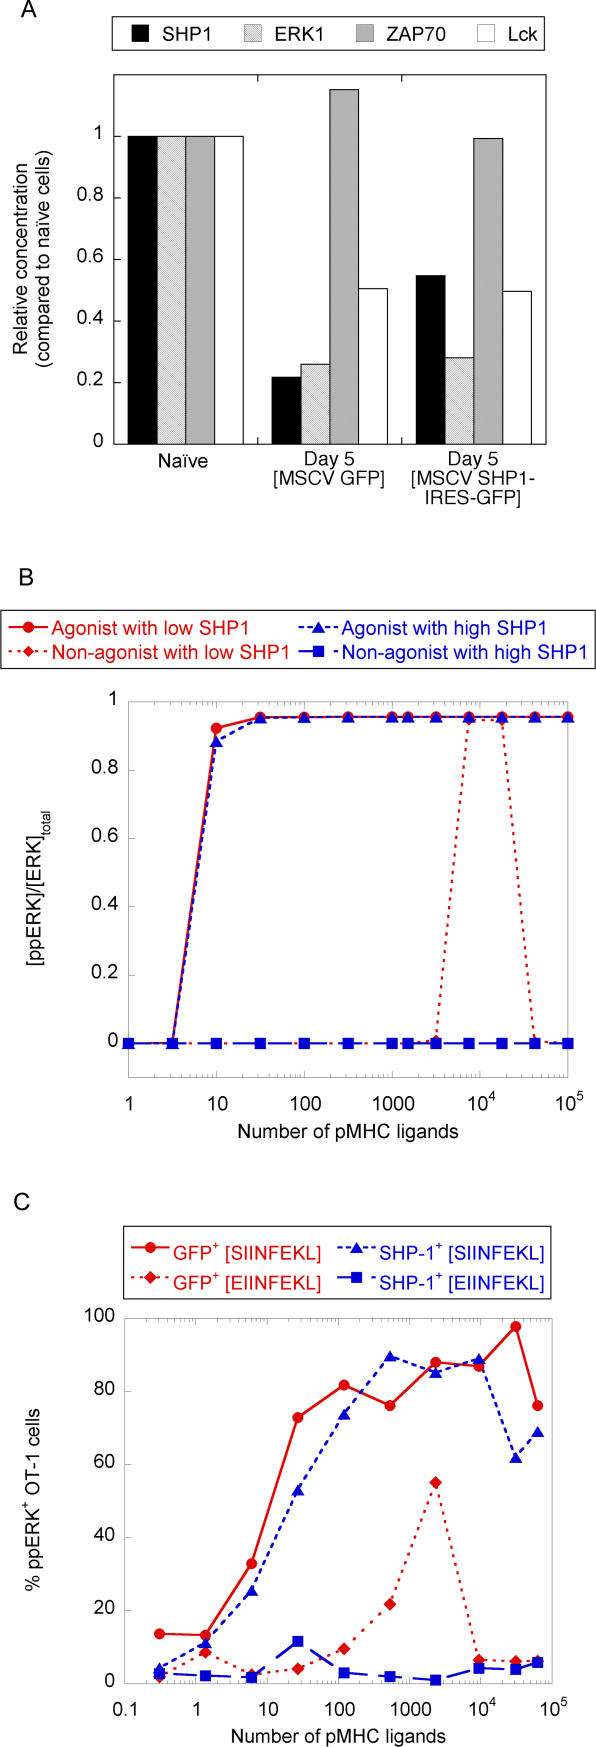
T-lymphocyte activation displays a remarkable combination of speed, sensitivity, and discrimination in response to peptide-major histocompatibility complex (pMHC) ligand engagement of clonally distributed antigen receptors (T cell receptors or TCRs). Even a few foreign pMHCs on the surface of an antigen-presenting cell trigger effective signaling within seconds, whereas 1 x 10(5)-1 x 10(6) self-pMHC ligands that may differ from the foreign stimulus by only a single amino acid fail to elicit this response. No existing model accounts for this nearly absolute distinction between closely related TCR ligands while also preserving the other canonical features of T-cell responses. Here we document the unexpected highly amplified and digital nature of extracellular signal-regulated kinase (ERK) activation in T cells. Based on this observation and evidence that competing positive- and negative-feedback loops contribute to TCR ligand discrimination, we constructed a new mathematical model of proximal TCR-dependent signaling. The model made clear that competition between a digital positive feedback based on ERK activity and an analog negative feedback involving SH2 domain-containing tyrosine phosphatase (SHP-1) was critical for defining a sharp ligand-discrimination threshold while preserving a rapid and sensitive response. Several nontrivial predictions of this model, including the notion that this threshold is highly sensitive to small changes in SHP-1 expression levels during cellular differentiation, were confirmed by experiment. These results combining computation and experiment reveal that ligand discrimination by T cells is controlled by the dynamics of competing feedback loops that regulate a high-gain digital amplifier, which is itself modulated during differentiation by alterations in the intracellular concentrations of key enzymes. The organization of the signaling network that we model here may be a prototypic solution to the problem of achieving ligand selectivity, low noise, and high sensitivity in biological responses.


Figures

Figure 1
Figure 1. Quantitation of Speed, Sensitivity, and Specificity of the Digital ppERK Response in Naïve T Cells
(A) Distribution of ERK phosphorylation (measured by flow cytometry) among individual naïve OT-1 T cells after 3 min of activation by RMA-S APCs at different levels of presentation of the agonist pMHC SIINFEKL-Kb. (B) Fit of the distribution of ppERK responses among OT-1 T cells activated with an average of 130 SIINFEKL-Kb ligands on the surface of each RMA-S APC. The fit (a sum of two log-normal distributions) is statistically adequate (χ2 = 1.72 for 128 points, and three fitting parameters). (C) Theoretical effect of biological variation (“noise”) in ligand presentation by APCs and the responsiveness of individual T cells on the steepness of the dose response of a population of T cells. The ppERK response of an individual T cell is essentially digital (infinite Hill coefficient), but the low observed Hill coefficient (1.9) for the dose response of real T cells at a population level can be explained by taking into account the noise in ligand presentation (CV = 50%) and the possible noise in the activation threshold of the T cells (CV = 75%). (D) Experimental ppERK dose response of naïve OT-1 T cells activated for 3 min with peptide-pulsed RMA-S cells, plotted as the percentage of responding cells. The Hill coefficient measured for this dose response is 1.9 ± 0.1 (n = 3). The threshold for activation (midpoint) is 24 ± 4 SIINFEKL-Kb on each RMA-S APC. Because the T cell's surface area is three times less than that of an RMA-S cell, as few as eight SIINFEKL-Kb ligands may be sufficient to trigger a full ppERK response if a full surface sweep of the RMA-S membrane by the T cell is not accomplished before signaling takes place. (E) Dose response for ERK phosphorylation among naïve OT-1 T cells, after 3 min of activation by RMA-S APC pulsed with SIINFEKL peptide variants. The peptide SIINFEKL is a known agonist for OT-1 T cells, whereas EIINFEKL and SIIRFEKL are non-agonists. The percentage of responding cells is plotted as a function of the number of peptide-Kb ligands presented on the surface of each RMA-S APC.
Figure 2
Figure 2. Computer Model of the Early Events of T-Cell Activation
(A) Sketch of model. Differential positive-/negative-feedback loops are added to a kinetic-proofreading scheme of pMHC–TCR interaction. At early times, phosphorylated TCR complexes activate SHP-1 (a tyrosine phosphatase), which provides a negative-feedback effect by dephosphorylating components within the TCR complex. Upon TCR engagement by an agonist-quality ligand, but with a time delay, the MAPK (ERK) cascade is activated and provides a positive-feedback effect by protecting the TCR complex from binding and dephosphorylation by SHP-1. (B) Explicit model of core module of the early events of TCR signaling (see Figure S6 for an expanded view of the model). (C) Table of the number and corresponding cytoplasmic concentrations of the signaling components involved in the model. An asterisk indicates molecules whose number and concentration are estimated. (D) Output of the computer simulation. After 3 min of simulated time, the TCR signaling machinery produces a sensitive and specific ppERK response. There is also a sharp transition in the ppERK response depending on the quality of the pMHC ligands (as measured by the lifetime, τ, of their interaction with TCR). Four categories of ligands can be defined from the simulation. For pMHCs whose t is above 15 s, a complete ppERK response is obtained with as few as ten ligands; these are the strong agonists. For pMHCs whose τ is between 3 and 15 s, a ppERK response is obtained when sufficient numbers of ligands are present; these are the weak agonists. pMHCs whose τ is below 3 s fail to trigger a ppERK response; these are non-agonists. Finally, because different combinations of feedback control are triggered by each category of ligands, ligands whose τ is below 1 s do not trigger negative feedback efficiently. These may constitute the majority of self-ligands, preventing self-recognition from depressing responses to full agonists [69].
Figure 3
Figure 3. Experimental Test of Two Predictions of the Computer Simulation of the Early Events in TCR Signaling
(A–C) Characteristic response time for ERK phosphorylation. The characteristic time of the ERK-phosphorylation response was derived by computer simulations of TCR signaling for increasing numbers of agonist ligands (whose lifetime of interaction with the TCR is set at 18 s) (A). This timescale diverges in a nonlinear fashion when the number of agonist ligands is decreased. We then systematically measured the kinetics of the ppERK response of naïve OT-1 T cells upon activation with RMA-S APCs presenting different numbers of SIINFEKL-Kb (B) and derived the characteristic time of response using a generic sigmoidal fit. The divergence of this timescale as the number of agonist ligands is decreased (C) is characteristic of kinase cascades acting as digital filters (A). (D–F) Comparison of antagonism in T-cell activation in computer simulations and experiments. (D) Computer simulation of antagonism. We simulated the ppERK response of T cells upon activation with increasing numbers of agonist ligands (whose interaction with the TCR has a lifetime of 18 s) in the presence of 30,000 non-agonist ligands (the two putative antagonist ligands being tested have TCR-interaction lifetimes of 1.7 s [weak antagonist] and 3 s [strong antagonist], respectively). The presence of a large number of sub-threshold ligands inhibits the agonist-induced ppERK response of T cells. The inhibition is calculated as the ratio of the ppERK response in T cells activated with agonist and antagonist together as compared to the ppERK response seen using the agonist alone. This hierarchy of antagonism in early T-cell responses is consistent with the graded activation of SHP-1-mediated negative feedback associated with signaling by sub-threshold ligands. (E) Experimental test of antagonism. Naïve OT-1 T cells were activated with RMA-S APCs pulsed with an increasing amount of agonist SIINFEKL peptide and an excess of EIINFEKL or SIIRFEKL peptides. (F) Experimental ppERK response of OT-1 T cells upon activation with RMA-S APCs presenting 25 agonist SIINFEKL-Kb ligands with or without 30,000 antagonists (SIIRFEKL-Kb [weak antagonist] or EIINFEKL-Kb [strong antagonist]).
Figure 4
Figure 4. Experimental Verification of the Predicted Role of Small SHP-1 Concentration Changes in Altering Ligand Discrimination by OT-1 T Cells
(A) Concentrations of signaling molecules in OT-1 T cells 5 d after activation and infection with MSCV retrovirus in vitro (day 5). These concentrations are normalized using the corresponding concentrations in the unstimulated naïve state (day 0). (B) Computer simulation of the responsiveness of T cells at day 5 after activation with the SHP-1 level set to that seen in the naïve state. The agonist pMHC is set to bind TCR with a characteristic time of 18 s and the non-agonist pMHC is set to bind TCR with a characteristic time of 3 s. (C) Elimination of the response of day-5 activated cells to EIINFEKL/Kb by expression of additional SHP-1. OT-1 T cells were infected with MSCV retrovirus expressing EGFP (control) or SHP-1/IRES/EGFP, and the ppERK response of infected OT-1 T cells to peptide-pulsed RMA-S was tested on day 5 after initial activation.

References

    1. Janeway CA, Travers P, Walport M, Shlomchik M. Immunobiology: The immune system in health and disease. New York: Garland Publishing; 2004.
    1. Paul WE. Fundamental immunology. Philadelphia: Lippincott-Raven; 2003.
    1. Germain RN. MHC-dependent antigen processing and peptide presentation: Providing ligands for T lymphocyte activation. Cell. 1994;76:287–299. - PubMed
    1. Chicz RM, Urban RG, Lane WS, Gorga JC, Stern LJ, et al. Predominant naturally processed peptides bound to HLA-DR1 are derived from MHC-related molecules and are heterogeneous in size. Nature. 1992;358:764–768. - PubMed
    1. Benoist C, Mathis D. T-lymphocyte differentiation and biology. In: Paul WE, editor. Fundamental immunology, 4th ed. Philadelphia: Lippincott-Raven; 1999. pp. 367–409.

Publication types

MeSH terms

Substances