. 2005 Oct 25;102(43):15412-7.
doi: 10.1073/pnas.0504614102. Epub 2005 Oct 17.

Single-stranded DNA mimicry in the p53 transactivation domain interaction with replication protein A

Affiliations

Single-stranded DNA mimicry in the p53 transactivation domain interaction with replication protein A

Elena Bochkareva et al. Proc Natl Acad Sci U S A. .

Abstract

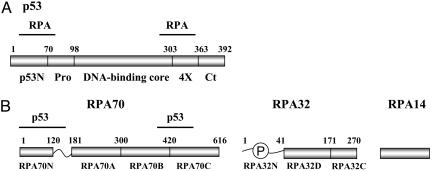
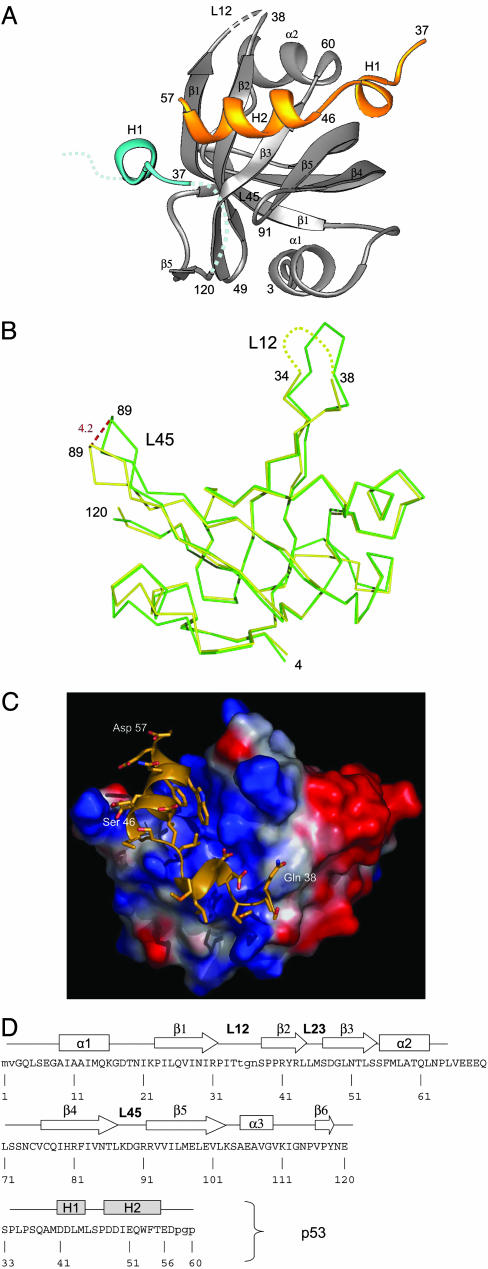
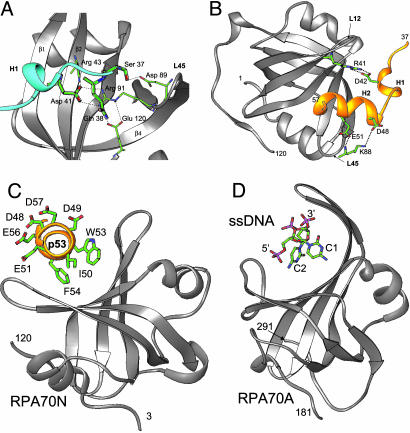
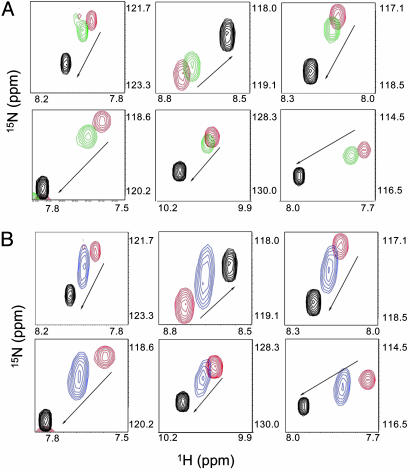
One of many protein-protein interactions modulated upon DNA damage is that of the single-stranded DNA-binding protein, replication protein A (RPA), with the p53 tumor suppressor. Here we report the crystal structure of RPA residues 1-120 (RPA70N) bound to the N-terminal transactivation domain of p53 (residues 37-57; p53N) and, by using NMR spectroscopy, characterize two mechanisms by which the RPA/p53 interaction can be modulated. RPA70N forms an oligonucleotide/oligosaccharide-binding fold, similar to that previously observed for the ssDNA-binding domains of RPA. In contrast, the N-terminal p53 transactivation domain is largely disordered in solution, but residues 37-57 fold into two amphipathic helices, H1 and H2, upon binding with RPA70N. The H2 helix of p53 structurally mimics the binding of ssDNA to the oligonucleotide/oligosaccharide-binding fold. NMR experiments confirmed that both ssDNA and an acidic peptide mimicking a phosphorylated form of RPA32N can independently compete the acidic p53N out of the binding site. Taken together, our data suggest a mechanism for DNA damage signaling that can explain a threshold response to DNA damage.


Figures

Fig. 1.
Fig. 1.
Binding regions for p53 and RPA70. Schematic representation of p53 (A) and RPA (B) with indicated borders of the protein domains. The major structural domains of p53 indicated are as follows: p53N, N-terminal domain; Pro, proline-rich domain; DNA binding core, central core domain; 4×, tetramerisation domain; Ct, C-terminal domain. The major structural domains of RPA indicated are as follows: RPA70N, N-terminal domain; RPA70A, RPA70B, RPA70C, RPA32D, DNA-binding domain A, B, C, and D, respectively. P, unstructured phosphorylated N terminus of subunit RPA32 (RPA32N). Horizontal lines above the schematics indicate previously identified sites of interaction.
Fig. 2.
Fig. 2.
Mapping of bindings regions for p53 and RPA70. (A)[35S]-labeled RPA subunits (RPA70, RPA32, and RPA14) were mixed with corresponding GST-fused p53 proteins [GST-p53, GST-p53 (1–73), GST-p53 (20–73), and GST]. Pull-down fractions were analyzed by 15% SDS/PAGE, followed by the autoradiography. Approximately 25–30% of the input RPA70 was bound to the GST-p53 beads. (B) [35S]-labeled RPA70-derived proteins [RPA70, RPA70 (1–422), and RPA70 (1–168)] were mixed with corresponding GST-fused derivatives of the p53 N-terminal part [GST-p53 (1–73), GST-p53 (20–73), and GST] and analyzed by 15% SDS/PAGE of the pull-down fractions, followed by the autoradiography.
Fig. 3.
Fig. 3.
Structure of RPA70N/p53N complex. (A) Ribbons presentation of the structure. The RPA70N is in gray, and the fusion p53 peptide is in blue. P53 from the symmetry-related molecule is in gold. H1 and H2 are helices within p53. Only the H1 helix of the blue p53 peptide is shown for clarity. (B) Conformational change in RPA70N induced by p53 binding. A superposition of free and bound RPA70N was generated as discussed in the text. Shown is the Cα trace of the free (green) and bound (yellow) domain. Important amino acids are labeled. Maximal shift of the L45 loop are indicated with dashed lines, and the size of the shift is indicated in angstroms (large numbers). The disordered L12 loop is represented by a dotted line. (C) pymol surface potential rendering of RPA70N. Positive and negative charge potential surfaces are blue and red, respectively. (D) Secondary structure elements of RPA70N and p53. RPA70N elements are referred to as in agreement with the nomenclature of the OB fold. The β-strands are indicated by arrows and the α-helices by boxes. The residues disordered in the structure are shown with a dashed line.
Fig. 4.
Fig. 4.
Structural mimicry in the p53N/RPA70N complex. Structural details of the p53 interaction with the fusion partner RPA70N (A) and symmetry-related RPA70N (B). (C) Aromatic side chains of p53 helix H2 mediate the interaction with the binding cleft of RPA70N and acidic side chains are exposed to solvent (Helix H1 is omitted for clarity). (D) Structure of RPA70A (ribbon diagram) bound to ssDNA (stick model). Bases C1 and C2 mediate interaction in the binding cleft and acidic phosphates exposed to solvent. RPA70N and p53 are colored as in Fig. 3A; the interacting residues are represented as thick sticks for p53, and thin sticks for RPA70N colored as per atom type: blue for nitrogen, red for oxygen, and green for carbon.
Fig. 5.
Fig. 5.
Displacement of p53N from RPA70N by addition of ssDNA and RPA32-Asp. The black peaks represent NMR resonances for unbound 15N-p53N and red peaks for 15N-p53N bound to RPA70N. Changes in resonance frequency are shown for specific p53 residues in the presence of ssDNA (green) (A) and RPA32-Asp (blue) (B). Peaks are labeled according to their residue-specific assignments. With the addition of either ssDNA or a RPA32-Asp peptide, the peaks migrate toward the position of unbound p53 as indicated by the arrows.

References

    1. Ko, L. J. & Prives, C. (1996) Genes Dev. 10, 1054-1072. - PubMed
    1. Levine, A. J. (1997) Cell 88, 323-331. - PubMed
    1. Dutta, A., Ruppert, J. M., Aster, J. C. & Winchester, E. (1993) Nature 365, 79-82. - PubMed
    1. He, Z., Brinton, B. T., Greenblatt, J., Hassell, J. A. & Ingles, C. J. (1993) Cell 73, 1223-1232. - PubMed
    1. Li, R. & Botchan, M. R. (1993) Cell 73, 1207-1221. - PubMed

Publication types