

Prediction of in vivo drug-drug interactions from in vitro data: impact of incorporating parallel pathways of drug elimination and inhibitor absorption rate constant
- PMID: 16236041
- PMCID: PMC1884945
- DOI: 10.1111/j.1365-2125.2005.02483.x
Prediction of in vivo drug-drug interactions from in vitro data: impact of incorporating parallel pathways of drug elimination and inhibitor absorption rate constant
Abstract
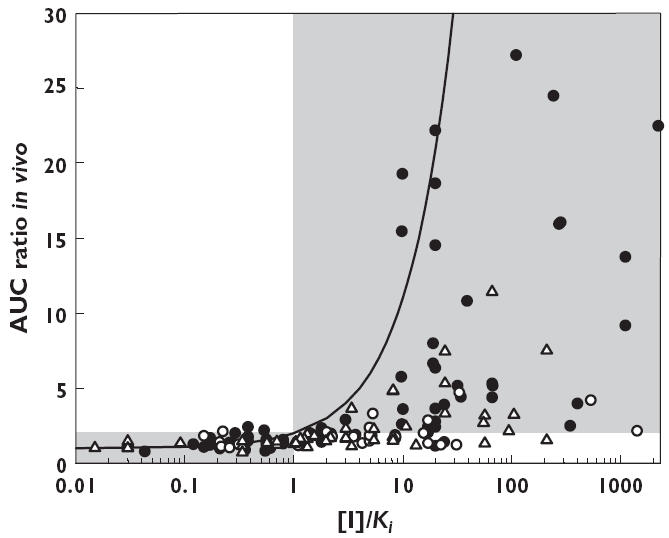
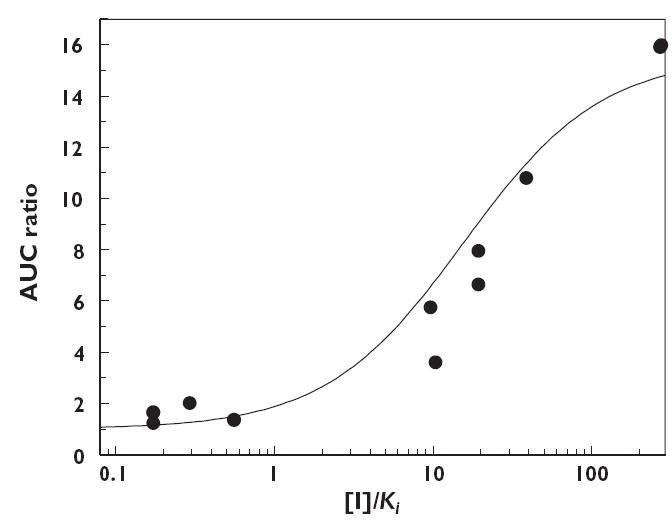
Aims: Success of the quantitative prediction of drug-drug interactions via inhibition of CYP-mediated metabolism from the inhibitor concentration at the enzyme active site ([I]) and the in vitro inhibition constant (K(i)) is variable. The aim of this study was to examine the impact of the fraction of victim drug metabolized by a particular CYP (f(mCYP)) and the inhibitor absorption rate constant (k(a)) on prediction accuracy.
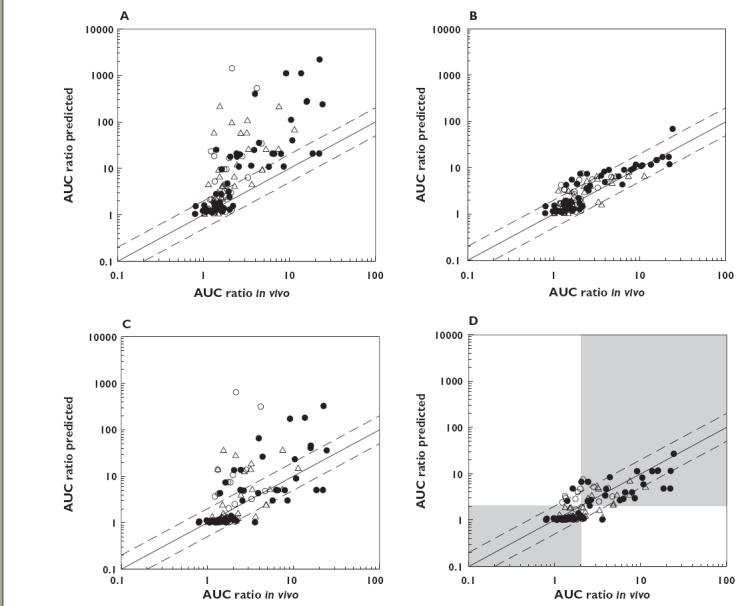
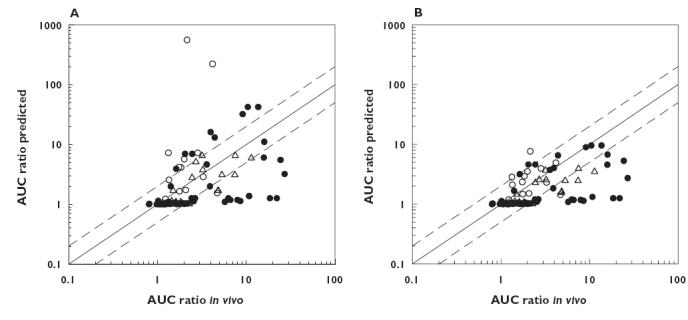
Methods: Drug-drug interaction studies involving inhibition of CYP2C9, CYP2D6 and CYP3A4 (n = 115) were investigated. Data on f(mCYP) for the probe substrates of each enzyme and k(a) values for the inhibitors were incorporated into in vivo predictions, alone or in combination, using either the maximum hepatic input or the average systemic plasma concentration as a surrogate for [I]. The success of prediction (AUC ratio predicted within twofold of in vivo value) was compared using nominal values of f(mCYP) = 1 and k(a) = 0.1 min(-1).
Results: The incorporation of f(mCYP) values into in vivo predictions using the hepatic input plasma concentration resulted in 84% of studies within twofold of in vivo value. The effect of k(a) values alone significantly reduced the number of over-predictions for CYP2D6 and CYP3A4; however, less precision was observed compared with the f(mCYP). The incorporation of both f(mCYP) and k(a) values resulted in 81% of studies within twofold of in vivo value.
Conclusions: The incorporation of substrate and inhibitor-related information, namely f(mCYP) and k(a), markedly improved prediction of 115 interaction studies with CYP2C9, CYP2D6 and CYP3A4 in comparison with [I]/K(i) ratio alone.
Figures
References
-
- Ito K, Iwatsubo T, Kanamitsu S, Ueda K, Suzuki H, Sugiyama Y. Prediction of pharmacokinetic alterations caused by drug–drug interactions: metabolic interaction in the liver. Pharmacol Rev. 1998;50:387–411. - PubMed
-
- Von Moltke LL, Greenblatt DJ, Schmider J, Wright CE, Harmatz JS, Shader RI. In vitro approaches to predicting drug interactions in vivo. Biochem Pharmacol. 1998;55:113–22. - PubMed
-
- Lin JH. Sense and nonsense in the prediction of drug–drug interactions. Curr Drug Metab. 2000;1:305–31. - PubMed
-
- Yao C, Levy RH. Inhibition-based metabolic drug–drug interactions: predictions from in vitro data. J Pharm Sci. 2002;91:1923–35. - PubMed
Publication types
MeSH terms
Substances
LinkOut - more resources
Full Text Sources
Other Literature Sources
Miscellaneous
