. 2005 Nov;132(22):5055-68.
doi: 10.1242/dev.02088. Epub 2005 Oct 19.

Mice deficient in Ext2 lack heparan sulfate and develop exostoses

Affiliations

Mice deficient in Ext2 lack heparan sulfate and develop exostoses

Dominique Stickens et al. Development. 2005 Nov.

Abstract

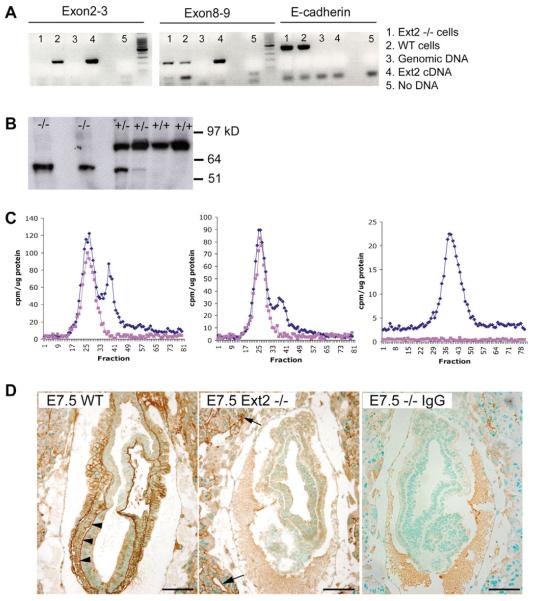
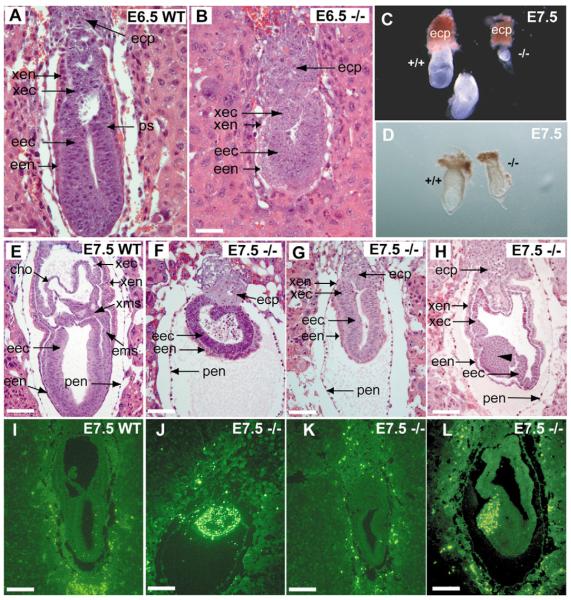
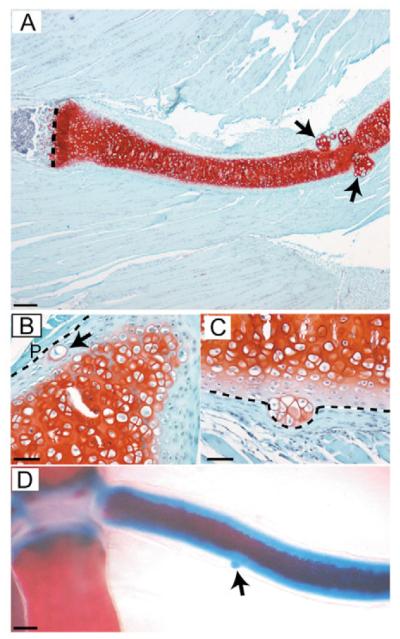
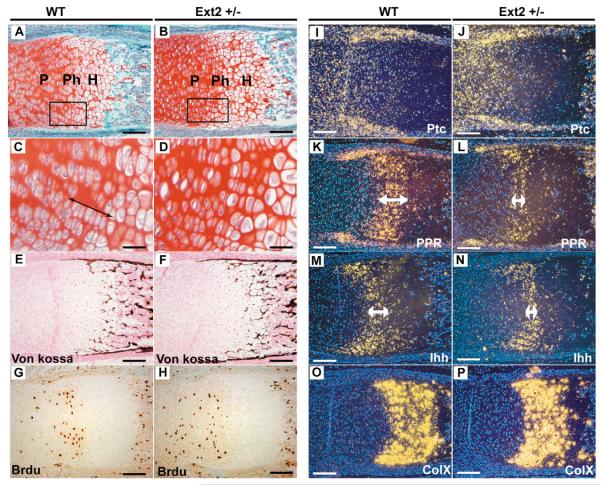
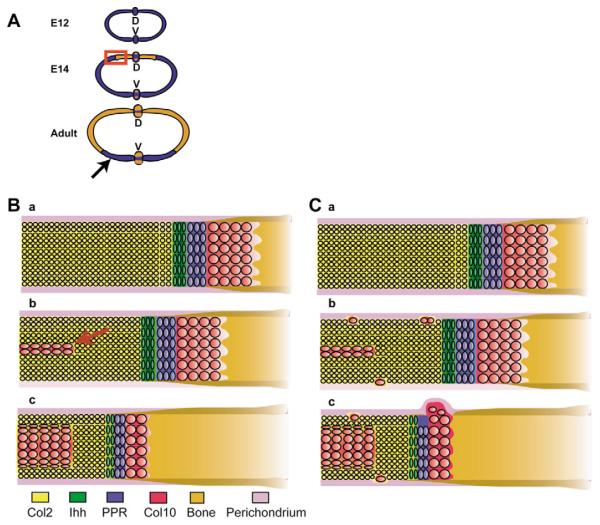
Hereditary multiple exostoses (HME) is a genetically heterogeneous human disease characterized by the development of bony outgrowths near the ends of long bones. HME results from mutations in EXT1 and EXT2, genes that encode glycosyltransferases that synthesize heparan sulfate chains. To study the relationship of the disease to mutations in these genes, we generated Ext2-null mice by gene targeting. Homozygous mutant embryos developed normally until embryonic day 6.0, when they became growth arrested and failed to gastrulate, pointing to the early essential role for heparan sulfate in developing embryos. Heterozygotes had a normal lifespan and were fertile; however, analysis of their skeletons showed that about one-third of the animals formed one or more ectopic bone growths (exostoses). Significantly, all of the mice showed multiple abnormalities in cartilage differentiation, including disorganization of chondrocytes in long bones and premature hypertrophy in costochondral cartilage. These changes were not attributable to a defect in hedgehog signaling, suggesting that they arise from deficiencies in other heparan sulfate-dependent pathways. The finding that haploinsufficiency triggers abnormal cartilage differentiation gives insight into the complex molecular mechanisms underlying the development of exostoses.


Figures

Fig. 1
Fig. 1
Analyses of heparan sulfate synthesis. (A) RT-PCR analyses of wild-type and Ext2+/− trophoblast stem cells (TSC). RT-PCR using a forward primer for exon 2 and a reverse primer for exon 3 shows a band of the correct size in the control lanes (2 and 4). No band can be detected in the lane with DNA from Ext2−/− TSC. When a forward primer against exon 8 and a reverse primer against exon 9 were used, a band in the lane with DNA from Ext2−/− TSC (4) is visible. Amplification with primers for E-cadherin was used as a control. (B) Western blot analyses. Cell lysates from wild-type, Ext2+/− and Ext2−/− TSC were incubated with a polyclonal antibody against EXT2 and show expected bands of 82 kDa in cell lysates from wild-type and Ext2+/− TSC. Lysates from Ext2+/− TSC show a second band of lower molecular weight. The lysates from Ext2−/− TSC show only the lower molecular weight protein. (C) ES cells derived from wild-type (left), Ext2+/− (middle) and Ext2−/− (right) embryos were grown in culture with 35SO4 and their GAGs were isolated. The blue symbols represent the recovery of counts before chondroitinase digestion, whereas the red points represent the recovery of counts after chondroitinase ABC digestion. Ext2−/− cells did not produce HS. (D) 10E4, an antibody that recognizes HS was used on sections of E7.5 wild-type (left) and Ext2−/− (middle) embryos. There is strong staining in the basement membranes of the wild-type embryo (arrowheads). Staining for HS was greatly diminished in Ext2−/− mutants, but strong staining can be seen in the maternal deciduae (arrows). The right-hand image shows incubation with IgG as a negative control. Scale bars: 100 μm.
Fig. 2
Fig. 2
Morphological analyses of Ext2 mutant embryos. In all sections, embryos are viewed laterally and the anterior side of the embryo is towards the left. (A) At E6.5, wild-type embryos have initiated the formation of a primitive streak and show an elongated egg cylinder. (B) Ext2−/− embryos have underdeveloped extra-embryonic structures and do not elongate. There are no signs of primitive streak formation. (C,D) Whole-mount embryos collected at E7.5. (C) Some Ext2−/− mutants show little or no elongation compared with wild-type littermates, but show a normal ectoplacental cone. (D) Other Ext2−/− mutants are only slightly smaller in overall size than wild-type embryos. (E-H) Hematoxylin and Eosin staining of longitudinal sections of wild-type (E) and Ext2−/− (F-H) embryos. (E) At E7.5, a wild-type embryo has well-defined embryonic and extra-embryonic structures. A layer of mesodermal cells is visible between ectoderm and endoderm. (F) Ext2−/− mutant (class 1) with a two-layered, rounded egg cylinder and no visible signs of extra-embryonic ectoderm, endoderm or mesoderm. (G) Ext2−/− mutant (class 2) with a two-layered egg cylinder that is about half the size of the wild-type embryo with significantly underdeveloped extra-embryonic structures. (H) A third group of Ext2−/− mutants (class 3) shows further elongation of a two-layered egg cylinder. Arrowhead in H indicates the formation of a headfold. (I-L) TUNEL assay examining cell death in wild-type E7.5 embryos (I) and class 1 (J), class 2 (K) and class 3 (L) E7.5 Ext2−/− mutants. Little or no cell death is observed in wild type (I) or class 2 Ext2−/− mutants (K). The extensive cell death in class 1 mutants shows this embryo is no longer viable (J). Cell death is visible in the headfold of class 3 mutants (L). cho, chorion; ecp, ectoplacental cone; eec, embryonic ectoderm; een, embryonic endoderm; ems, embryonic mesoderm; pen, parietal endoderm (attached to inner aspect of Reichert’s membrane); ps, primitive streak; xec, extra-embryonic ectoderm; xen, extra-embryonic endoderm; xms, extra-embryonic mesoderm. Scale bars: 50 μm in A,B; 100 μm in E-H; 140 μm in I-L.
Fig. 3
Fig. 3
In situ hybridization analyses of Ext2−/− mutants. Hybridization was performed with 35S-labeled riboprobes and sections were counterstained with Hematoxylin (A-J) or Hoechst (K-T). In all sections, embryos are viewed laterally and the anterior side of the embryo is towards the left. (A-H) Embryos collected at E6.5. (A,B) H19, a marker for extra-embryonic tissues shows the presence of extra-embryonic ectoderm, endoderm, ectoplacental cone and trophoblast giant cells in Ext2−/−. The broken line indicates the difference in development of the extra-embryonic parts of the egg cylinder. (C,D) Apoe, a marker for visceral endoderm, is expressed in Ext2−/− embryos. (E,F) Fgf8, a marker for primitive streak formation, is detected in wild-type embryos and in Ext2−/−. (G,H) Brachyury (T), another marker for primitive streak and mesodermal cells, is present in wild-type embryos, but not in Ext2 mutants. Embryos collected at E7.5 (I-T). (J) Class 2 mutant; (L,N,P,R,S,T) class 3 mutants; (I,K,M,O,Q) wild type. Brachyury is expressed in class 2 mutants (J) and in class 3 mutants (L,N,P,R,S,T). (M,N) H19 was used as a probe to show the boundaries between embryonic and extra-embryonic regions of the wild-type embryos and Ext2−/− mutants. (O,P) Lim1 is expressed in wild-type embryos at low levels in primitive streak and at higher levels in mesodermal cells migrating away from the streak. Arrowheads indicate several cells expressing Lim1 in the Ext2−/− mutants. (Q,R) Snai1 expression is shown in the primitive streak and nascent mesoderm of wild-type embryos (Q) but is absent in Ext2−/− embryos (R). (S) Otx2 and (T) Hesx1 mRNAs are detected in the anterior cell mass of class 3 Ext2 mutants. ecp, ectoplacental cone; eec, embryonic ectoderm; ps, primitive streak; tgc, trophoblast giant cells; ven, visceral endoderm. Scale bars: 50 μm in A-H; 100 μm in I-T.
Fig. 4
Fig. 4
Exostosis formation in ribs of Ext2+/− mice. (A) Dissected rib of a wild-type mouse and an Ext2+/− mouse with an exostosis (indicated by the arrow). The boundaries between the costochondral cartilage and the bony part of the rib are indicated by the broken lines. (B) Higher magnification showing larger exostosis on a rib of an Ext2+/− mouse. (C,D) Trichrome-stained histological section of the costochondral junction of rib from a wild-type mouse (C) and a rib from an Ext2+/− mouse with an exostosis (D). The exostosis is composed of cortical and medullary bone with an overlying hyaline cartilage cap (indicated by arrows). The bone marrow cavity of the exostosis is continuous with that of the underlying bone. (E) Magnification of the boxed area in D. Within the cartilage cap, some chondrocytes appear to line up, resembling the organization of chondrocytes in a normal growth plate. (F) Staining of adjacent section to the one shown in E with the HS antibody 10E4 shows that chondrocytes produce HS. Inset in upper right-hand corner shows control staining with mouse IgG as primary antibody. B, bone; BM, bone marrow; C, cartilage. Scale bars: 3.5 mm in A,B; 300 μm in C,D; 50 μm in E,F.
Fig. 5
Fig. 5
Chondrocyte abnormalities. All histological sections have been stained with Safranin O. (A) Longitudinal section of a rib of an Ext2+/− mouse shows nodules of displaced chondrocytes (arrows). The costochondral boundary is indicated by a broken line. (B) Transverse section through rib showing single displaced chondrocyte (arrow) near the perichondrium (P). (C) Higher magnification of longitudinal section through a rib of an Ext2+/− mouse showing a nodule, forcing the perichondrium to bulge out. In B and C, the broken lines indicate the boundary between perichondrium and cartilage. (D) Low magnification of Alcian Blue (cartilage) and Alizarin Red (bone) staining of a rib of an Ext2+/− showing a large nodule (arrow). Scale bars: 200 μm in A; 50 μm in B,C; 300 μm in D.
Fig. 6
Fig. 6
Rib cartilage differentiation in wild-type mice. Orientation and location of the sections in this figure are indicated in the bottom left-hand panel of the figure (black rectangle represents transverse section, red arrow represents longitudinal section). (A,B) Transverse sections through the rib cartilage stained with Safranin O. (A) Section through rib of 1-week-old mouse. Chondrocytes have a uniform undifferentiated appearance. (B) Beyond 2 weeks of age, chondrocytes in the center of the element become hypertrophic, while cells in the periphery remain undifferentiated. (C-G) In situ hybridization with probes for Col2 and Col10. (C,D) Until 1 week of age, all chondrocytes, except for the hypertrophic chondrocytes of the growth plate, express Col2. (E-G) At 2 weeks of age, chondrocytes in the center of the rib cartilage turn off expression of Col2 (area indicated by yellow arrows in E and F), while cells in the periphery, near the perichondrium, continue to express Col2. Chondrocytes in the center now express Col10 (G). GP, growth plate. Scale bars: 100 μm.
Fig. 7
Fig. 7
(A) Safranin O stained longitudinal section of a rib of a 2-week-old wild-type mouse is shown. Rectangle indicates area of interest representative for B and C. (B) Rib of a Ext2+/−. Arrow indicates the location of a chondrocyte nodule. Asterisk indicates location of the proliferative zone of the rib growth plate. The inset in the top right-hand corner shows a magnification of the nodule. (C) BrdU staining of adjacent serial section shown in B. BrdU-positive cells can be seen in the proliferative zone of the growth plate of the ribs (arrowhead). The chondrocyte nodule does not contain BrdU-positive cells (arrow). (D,E) Higher magnification of the area with the nodules shown in B and C. (D) In situ hybridization with Col10 antisense probe shows expression by chondrocytes located in the center of the rib cartilage. The nodule of displaced chondrocytes (encircled by the broken line) expresses Col10 and are separated from the centrally located hypertrophic cells by a layer of chondrocytes that do not express Col10. (E) Staining with the HS antibody 10E4 shows that the chondrocytes in the nodules (encircled by the broken line) produce HS. Inset in E shows staining with 10E4 after heparinase treatment. Scale bars: 200 μm in A-C; 50 μm in D,E.
Fig. 8
Fig. 8
A constitutively active Col2-Pthr1 transgene (*PPR) was crossed into the Ext2+/− mice. Ribs of wild-type mice (A) and mice carrying the *PPR transgene (B) do not show any cartilage abnormalities. (C) Ext2+/− mice show the characteristic nodules (encircled by the broken line). (D) Introduction of the *PPR transgene does not eliminate the premature hypertrophic differentiation in the rib cartilage of Ext2+/− mice. Broken lines encircle the nodules. Scale bars: 200 μm.
Fig. 9
Fig. 9
Examination of the Ext2+/− long bone growth plate. Growth plates from ulnae of E18.5 wild type and Ext2+/− were analyzed for proliferation and differentiation defects. (A,B) Safranin O staining shows a similar overall structure of the growth plates of a wild-type and Ext2+/− mice. (C,D) Magnification of the rectangular areas in A and B, respectively. Close examination of the chondrocytes in the proliferative zone shows a loss of the characteristic columnar organization normally seen in wild-type growth plates (arrow indicates typical columnar organization). (E,F) Von Kossa stained sections shows the presence of mineralized tissue in the growth plates of both genotypes. (G,H) BrdU labeling shows a similar number of labeled cells in the proliferating zone of the growth plates of wild-type and Ext2+/− mice. (I-P) In situ hybridization with markers for chondrocyte differentiation show Ext2+/− mice expressed Ptch1, Ihh, Pthr1 (PPR) and ColX in appropriate places but there is a small decrease in the expression domain of Pthr1 and Ihh (compare arrow in K with arrow in L, and arrow in M with arrow in N). P, Proliferating chondrocytes; Ph, Pre-hypertrophic chondrocytes; H, Hypertrophic chondrocytes. Scale bars: 100 μm in A,B,E-P; 50 μm in C,D.
Fig. 10
Fig. 10
(A) Schematic representation of the rib ossification process. At embryonic day 12, the entire rib consists of cartilage. Starting at embryonic day 14, a growth plate is established and ossification begins, proceeding ventrally towards the sternum. The ossification process continues until the mice reach adulthood and an area of permanent costochondral cartilage (arrow) remains throughout life. Red rectangle indicates area represented in B,C. Cartilage is blue and bone is brown. (B) Schematic representation of rib growth plate and chondrocyte differentiation. (a) Around E14, the rib cartilage template becomes invaded by blood vessels, osteoblasts and osteoclasts, and a growth plate is established. Chondrocytes, which are not part of the growth plate, express Col2. (b) When mice reach the age of 2 weeks, chondrocytes in the center of the rib cartilage become hypertrophic and express Col10 (red arrow). (c) When mice reach skeletal maturity, this hypertrophic region expands towards the periphery of the perichondrium, while the growth plate becomes smaller and replacement of cartilage with bone stops. (C) Schematic representation of rib chondrocyte differentiation in Ext2 heterozygotes. (a) During early stages of development, no differences can be observed in between rib cartilage of wild-type and Ext2+/− mice. (b) By the age of 2 weeks, however, nodules of Col10-expressing chondrocytes are being formed near the perichondrium as a result of premature hypertrophic differentiation. (c) Formation of an exostosis could be the result of the growth plate moving past a nodule, creating a disruption in bone collar formation. Alternatively, the passage of the growth plate might provide vascularization to the nodule and initiate the bony outgrowth of an exostosis. D, dorsal; V, ventral.

References

    1. Ahn J, Ludecke HJ, Lindow S, Horton WA, Lee B, Wagner MJ, Horsthemke B, Wells DE. Cloning of the putative tumour suppressor gene for hereditary multiple exostoses (EXT1) Nat. Genet. 1995;11:137–143. - PubMed
    1. Albrecht U, Eichele G, Helms JA, Lu H. Visualization of gene expression patterns by in situ hybridization. In: Daston G, editor. Molecular and Cellular Methods in Developmental Toxicology. CRC Press; Boca Raton: 1997. pp. 23–48.
    1. Ang SL, Conlon RA, Jin O, Rossant J. Positive and negative signals from mesoderm regulate the expression of mouse Otx2 in ectoderm explants. Development. 1994;120:2979–2989. - PubMed
    1. Arman E, Haffner-Krausz R, Chen Y, Heath JK, Lonai P. Targeted disruption of fibroblast growth factor (FGF) receptor 2 suggests a role for FGF signaling in pregastrulation mammalian development. Proc. Natl. Acad. Sci. USA. 1998;95:5082–5087. - PMC - PubMed
    1. Bame KJ, Esko JD. Undersulfated heparan sulfate in a Chinese hamster ovary cell mutant defective in heparan sulfate N-sulfotransferase. J. Biol. Chem. 1989;264:8059–8065. - PubMed

Publication types

MeSH terms