. 2006 Jan;17(1):192-202.
doi: 10.1091/mbc.e05-05-0408. Epub 2005 Oct 19.

K-ras4B and prenylated proteins lacking "second signals" associate dynamically with cellular membranes

Affiliations

K-ras4B and prenylated proteins lacking "second signals" associate dynamically with cellular membranes

John R Silvius et al. Mol Biol Cell. 2006 Jan.

Abstract

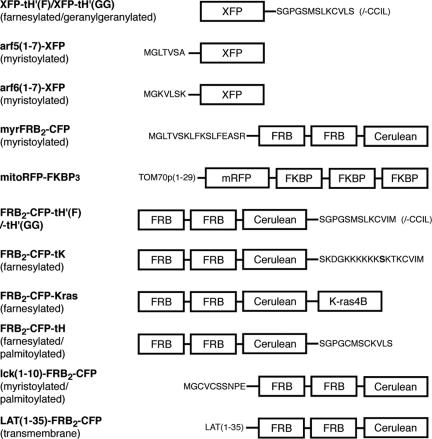
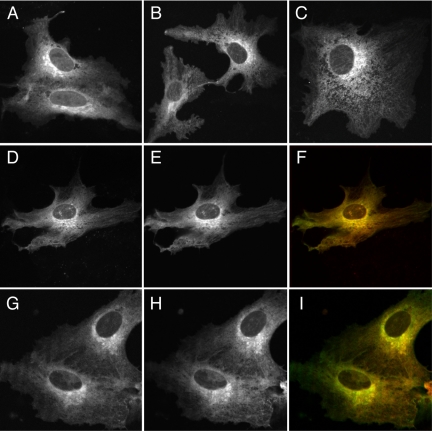
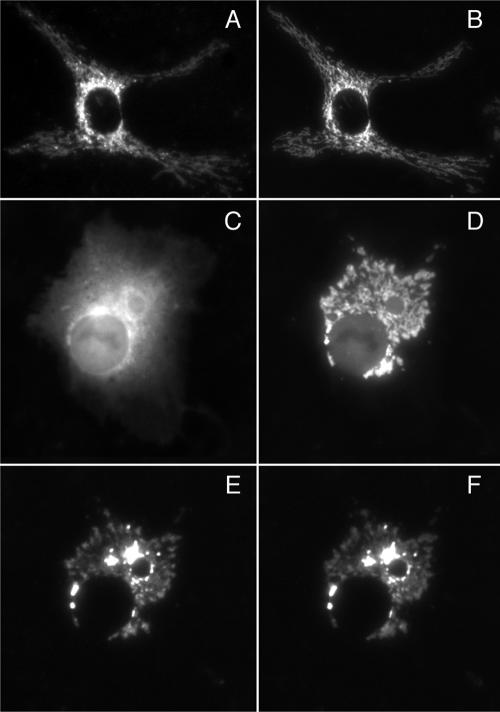
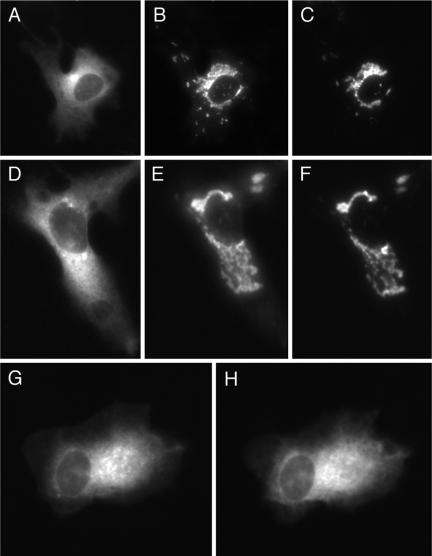
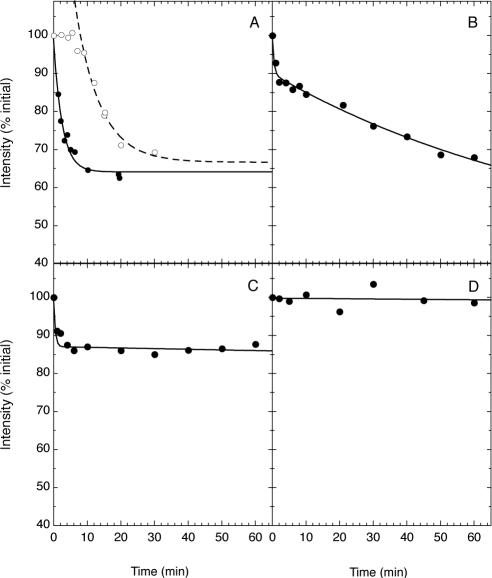
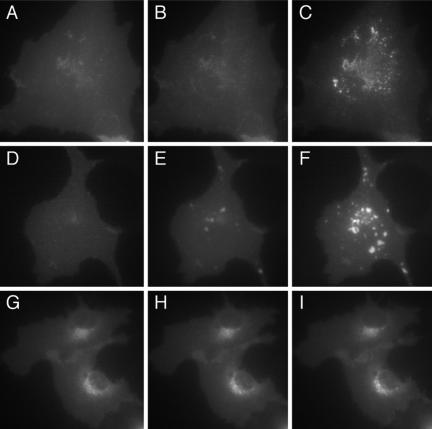
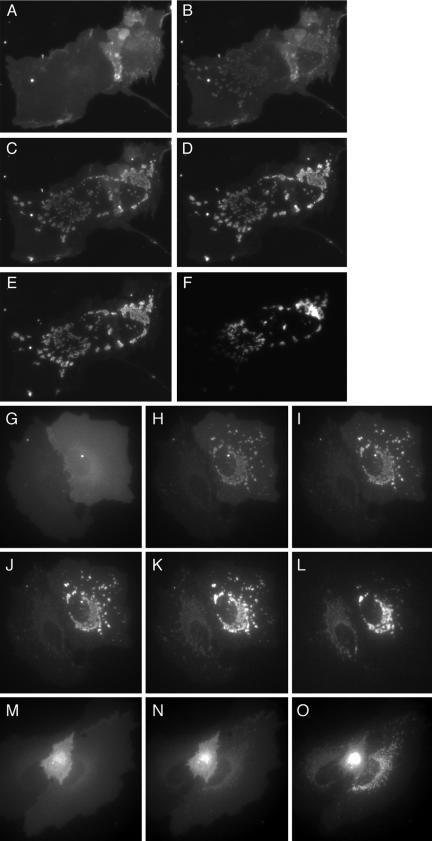
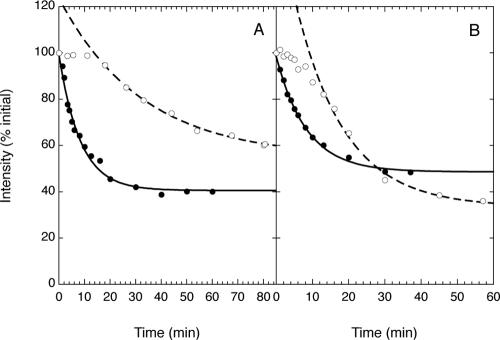
We have used fluorescence microscopy and the technique of rapamycin-regulated protein heterodimerization to examine the dynamics of the subcellular localizations of fluorescent proteins fused to lipid-modified protein sequences and to wild-type and mutated forms of full-length K-ras4B. Singly prenylated or myristoylated fluorescent protein derivatives lacking a "second signal" to direct them to specific subcellular destinations, but incorporating a rapamycin-dependent heterodimerization module, rapidly translocate to mitochondria upon rapamycin addition to bind to a mitochondrial outer membrane protein incorporating a complementary heterodimerization module. Under the same conditions analogous constructs anchored to the plasma membrane by multiply lipid-modified sequences, or by a transmembrane helix, show very slow or no transfer to mitochondria, respectively. Interestingly, however, fluorescent protein constructs incorporating either full-length K-ras4B or its plasma membrane-targeting sequence alone undergo rapamycin-induced transfer from the plasma membrane to mitochondria on a time scale of minutes, demonstrating the rapidly reversible nature of K-ras4B binding to the plasma membrane. The dynamic nature of the plasma membrane targeting of K-ras4B could contribute to K-ras4B function by facilitating redistribution of the protein between subcellular compartments under particular conditions.


Figures

Figure 1.
Figure 1.
Structures of fluorescent protein constructs created for this study. The construct FRB2-CFP-tK(S181A) was generated by mutating to alanine the serine residue shown in boldface in the structure of FRB2-CFP-tK.
Figure 2.
Figure 2.
Confocal microscopic images showing the subcellular distributions of prenylated and myristoylated fluorescent proteins in CV-1 cells. (A–C) Images of (A) FRB2-CFP-tH′(F), (B) FRB2-CFP-tH′(GG), and (C) myr-FRB2-CFP. (D and E) Images of FRB2-CFP-tH′(GG) and YFP-tH′(GG), respectively; (F) merged image (green is YFP-tH′(GG)). (G and H) Images of Arf6(1–7)-CFP and YFP-tH′(GG), respectively; (I) merged image (green is YFP-tH′(GG)).
Figure 3.
Figure 3.
Rapamycin-induced redistribution to mitochondria of farnesylated FRB2-CFP-tH′(F) in cells transiently expressing the protein together with mitochondrially anchored mitoRFP-FKBP3. Limited resolution in some images is due to the use of short exposure times to minimize potential photobleaching. (A and B) Fluorescence images of mitoRFP-FKBP3 and of a mitochondrial matrix-targeted CFP derivative, pOCT(1–37), respectively, in a COS-1 cell transiently expressing the two proteins. (C and D) Fluorescence images of FRB2-CFP-tH′(F) before (C) and 5 min after (D) addition of rapamycin (0.5 μM). (E and F) Fluorescence images of mitoRFP-FKBP3 before (E) and 5 min after (F) addition of rapamycin to the same cell as shown in C and D.
Figure 4.
Figure 4.
Rapamycin-induced redistribution of lipid-modified, FRB-domain-incorporating fluorescent proteins. (A–C) Subcellular distribution of FRB2-CFP-tH′(GG) at 0 (A) and 5 min after (B) addition of rapamycin to a CV-1 cell coexpressing the protein together with mitoRFP-FKBP3, whose distribution 5 min after rapamycin addition is shown in C. (D–F) Subcellular distribution of myrFRB2-CFP at 0 (D) and 5 min after (E) addition of rapamycin to CV-1 cells coexpressing the protein together with mitoRFP-FKBP3, whose distribution 5 min after rapamycin addition is shown in F. (G and H) Subcellular distribution of FRB2-CFP-tH′(GG) at 0 (G) and 5 min after (H) addition of rapamycin to a CV-1 cell not coexpressing the mitoRFP-FKBP3 construct.
Figure 5.
Figure 5.
Quantitative analysis, carried out as described in the text, of the kinetics of rapamycin- or rapalog-induced translocation to mitochondria of protein constructs coexpressed with mitoRFP-FKBP3 in CV-1 cells. (A) Time courses of redistribution of FRB2-CFP-tH′(GG) upon addition of 0.5 μM rapamycin (•) or 1 μM rapalog AP21967 (○). The complete time courses determined for rapamycin-treated cells, and the rapid (post-lag) phases of those determined for AP29167-treated cells, were fit as illustrated to an equation of the form I = A + B·exp(–kt), where I is the mean pixel intensity determined for a fixed region of the cell image, A and B are adjustable scaling parameters, and k is the rate constant for the redistribution process. Values of k determined in this manner are summarized in Table 1. (B–D) Time courses of rapamycin-induced redistribution of (B) FRB2-CFP-tH, (C) lck(1–10)-FRB2-CFP, and (D) LAT(1–35)-FRB2-CFP in CV-1 cells under conditions similar to those described for A. Data shown in B and C are fit with a biexponential decay curve and those in D to a monoexponential decay curve (in the latter case yielding a rate constant << 10–4 min–1, indicating negligible transfer from the plasma membrane). The values of k summarized in Table 1 for translocation of FRB2-CFP-tH, and lck(1–10)-FRB2-CFP correspond to the rate constants estimated for the slow phase of fluorescence redistribution. Because of the nature of the image analysis and the deliberate use of overly conservative image-background corrections in data quantification, the magnitudes of the intensity decays shown (expressed as a percentage of the initial intensity) should not be directly equated to the percentages of translocation of the protein constructs, which will typically be somewhat larger and can be better assessed from original images like those shown in Figures 3, 4, and 6.
Figure 6.
Figure 6.
Effects of rapamycin on the subcellular distribution (in CV-1 cells coexpressing mitoRFP-FKBP3) of fluorescent FRB domain-containing protein constructs anchored to membranes via multiply lipid-modified or transmembrane sequences. (A–C) Cell expressing FRB2-CFP-tH imaged before (A) and 5 min (B) or 60 min (C) after addition of rapamycin (0.5 μM). (D–I) Cells expressing lck(1–10)-FRB2-CFP (D–F) and LAT(1–35)-FRB2-CFP (G–I), imaged at the same times as indicated for A–C.
Figure 7.
Figure 7.
Rapamycin- or rapalog-induced redistribution to mitochondria of fluorescent FRB-domain-containing constructs incorporating the K-ras4B-targeting sequence or fulllength K-ras4B in CV-1 cells coexpressing the mitoRFP-FKBP3 construct. (A–F) Subcellular distribution of FRB2-CFP-tK at 0 (A), 1 (B), 5 (C), 20 (D), and 60 min (E) after addition of rapamycin; (F) distribution of mitoRFP-FKBP3 in the same cells 60 min after rapamycin addition. The distribution of mitoRFP-FKBP3 at 0 min (unpublished data) was very similar. (G–L) Subcellular distribution of FRB2-CFP-Kras at 0 (G), 2 (H), 5 (I), 10 (J), and 45 min (K) after rapamycin addition; (L) distribution of mitoRFP-FKBP3 45 min after rapamycin addition. (M–O) Distribution of FRB2-CFP-Kras at 0 (M), 10 (N), and 45 min (O) after addition of rapalog AP29167.
Figure 8.
Figure 8.
Kinetic analysis of rapamycin-induced intracellular redistribution of FRB2-CFP-tK and FRB2-CFP-Kras upon addition of rapamycin or rapalog AP29167 to CV-1 cells coexpressing the mitoRFP-FKBP3 protein. (A) Time courses of redistribution of FRB2-CFP-tK upon addition of 0.5 μM rapamycin (•)or1 μM rapalog (○). (B) Redistribution of FRB2-CFP-Kras upon addition of rapamycin (•) or rapalog (○).

Similar articles

Cited by

References

    1. Apolloni, A., Prior, I. A., Lindsay, M., Parton, R. G., and Hancock, J. F. (2000). H-ras but not K-ras traffics to the plasma membrane through the exocytic pathway. Mol. Cel. Biol. 20, 2475–2487. - PMC - PubMed
    1. Baker, T. L., Booden, M. A., and Buss, J. E. (2000). S-Nitrosocysteine increases palmitate turnover on Ha-Ras in NIH 3T3 cells. J. Biol. Chem. 275, 22037–22047. - PubMed
    1. Baker, T. L., Zheng, H., Walker, J., Coloff, J. L., and Buss, J. E. (2003). Distinct rates of palmitate turnover on membrane-bound cellular and oncogenic Hras. J. Biol. Chem. 278, 19292–19300. - PubMed
    1. Beranger, F., Goud, B., Tavitian, A., and de Gunzburg, J. (1991). Association of the Ras-antagonistic Rap1/Krev-1 proteins with the Golgi complex. Proc. Natl. Acad. Sci. USA 88, 1606–1610. - PMC - PubMed
    1. Bivona, T. G., Perez De Castro, I., Ahearn, I. M., Grana, T. M., Chiu, V. K., Lockyer, P. J., Cullen, P. J., Pellicer, A., Cox, A. D., and Philips, M. R. (2003). Phospholipase Cγ activates Ras on the Golgi apparatus by means of RasGRP1. Nature 424, 694–698. - PubMed

Publication types

LinkOut - more resources