. 2005 Nov;187(21):7185-92.
doi: 10.1128/JB.187.21.7185-7192.2005.

Diversification of DNA sequences in the symbiotic genome of Rhizobium etli

Affiliations

Diversification of DNA sequences in the symbiotic genome of Rhizobium etli

Margarita Flores et al. J Bacteriol. 2005 Nov.

Abstract

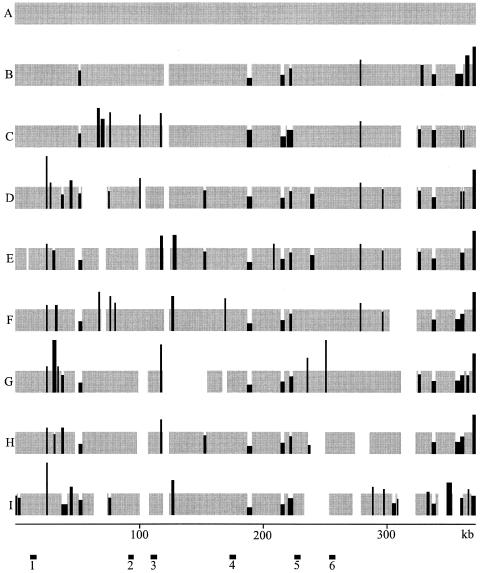
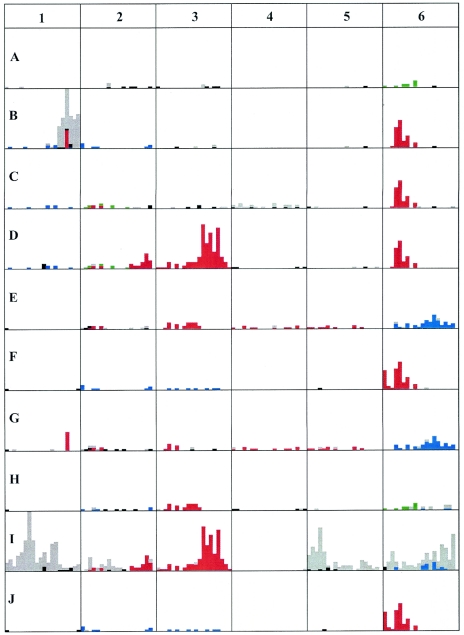
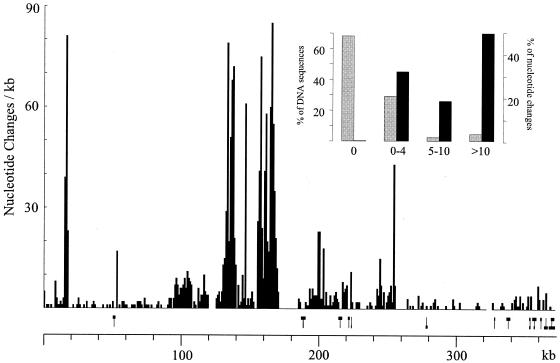
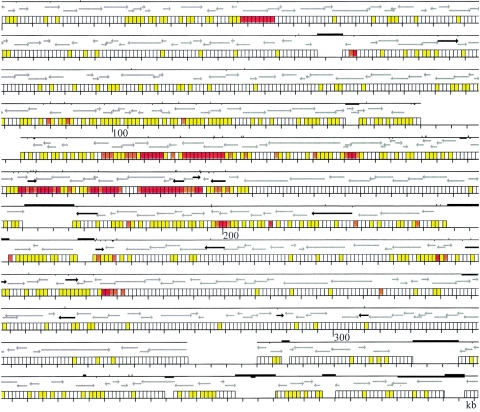
Bacteria of the genus Rhizobium and related genera establish nitrogen-fixing symbioses with the roots of leguminous plants. The genetic elements that participate in the symbiotic process are usually compartmentalized in the genome, either as independent replicons (symbiotic plasmids) or as symbiotic regions or islands in the chromosome. The complete nucleotide sequence of the symbiotic plasmid of Rhizobium etli model strain CFN42, symbiont of the common bean plant, has been reported. To better understand the basis of DNA sequence diversification of this symbiotic compartment, we analyzed the distribution of single-nucleotide polymorphisms in homologous regions from different Rhizobium etli strains. The distribution of polymorphisms is highly asymmetric in each of the different strains, alternating regions containing very few changes with regions harboring an elevated number of substitutions. The regions showing high polymorphism do not correspond with discrete genetic elements and are not the same in the different strains, indicating that they are not hypervariable regions of functional genes. Most interesting, some highly polymorphic regions share exactly the same nucleotide substitutions in more than one strain. Furthermore, in different regions of the symbiotic compartment, different sets of strains share the same substitutions. The data indicate that the majority of nucleotide substitutions are spread in the population by recombination and that the contribution of new mutations to polymorphism is relatively low. We propose that the horizontal transfer of homologous DNA segments among closely related organisms is a major source of genomic diversification.


Figures

FIG. 1.
FIG. 1.
General structure of the symbiotic genome compartment of different strains of R. etli. The general structure of the symbiotic compartment was inferred from a concatenated PCR analysis based on the nucleotide sequence of model strain CFN42 (strain A) (Table 1). Gray segments correspond to regions covered by PCR products of the same length as those of strain A, about 5 kb (see Materials and Methods). Black segments correspond to regions covered by PCR products of different lengths than CFN42, indicating the presence of indels. The height of the black segments indicates the relative amount of DNA compared to that of CFN42 (which in all cases corresponds to about 5 kb). The width of the black segments indicates the maximum length of the region in which the corresponding indel could be present. White segments correspond to regions where the PCR products could not be concatenated. The scale, in kilobases, corresponds to the continuous nucleotide sequence of CFN42. The bars labeled 1 to 6 at the bottom correspond to the segments selected for the DNA sequence analysis presented in Fig. 2. Letters A to I correspond to the codes for the different strains (Table 1).
FIG. 2.
FIG. 2.
Nucleotide sequence diversity among selected regions of the symbiotic compartment of different strains of R. etli. The nucleotide sequence of PCR products corresponding to regions 1 to 6 (Fig. 1) was obtained from different R. etli strains. For each region, the nucleotide sequences of the strains were aligned by Clustal W, and a consensus sequence was obtained for each nucleotide position. In cases where half of the strains presented the same nucleotide and the other five shared another nucleotide, the consensus was arbitrarily defined as the nucleotide present in the group containing strain A. Differences from the consensus were defined for the different regions for each strain. The results are plotted as bars representing the number of nucleotides differing from the consensus in consecutive windows of 250 nt. For each region, the rules for the color code are as follows. Red, blue, and green represent identical nucleotide variations from the consensus in different strains; black represents nucleotides differing from the consensus shared by at least two strains in cases where any two strains do not share >5 nucleotides (nt) differing from the consensus in the whole 5-kb region; gray represents nucleotides differing from the consensus in only one of the strains. Although the rules of the color code are the same for the different regions, the colors are only valid for each specific DNA region. Regions are indicated by numbers as in Fig. 1; the letters A to J represent different strains (Table 1); the length of each DNA region corresponds to 5 kb; the height of each square corresponds to 35 nt changes.
FIG. 3.
FIG. 3.
Analysis of the nucleotide sequence variation between the symbiotic compartments of two R. etli strains. The nucleotide sequences of the homologous regions between strains A (10) and B (this work) were compared and are presented as number of nucleotide changes per kilobase. Indels were not counted as nucleotide differences. Small indels, usually 1 to 6 nt, are not indicated; indels of >300 bp are schematized above the scale as bars showing the length of the indel at the top (where strain A contains more DNA sequence) or at the bottom (where strain B contains more DNA sequence). The scale corresponds to the nucleotide sequence of strain A, as previously reported (10). The inset correlates the percentage of the total number of nucleotide differences between the two strains. The homologous sequence was analyzed in 250-bp windows, and the percentages of DNA and of nucleotide changes are shown as a function of the number of nucleotide differences present in the corresponding windows.
FIG. 4.
FIG. 4.
Nucleotide variation between strains A and B in relation to the annotation of strain A (10). For each region, three rows are shown. The bottom rows present the scale in kilobases according to strain A divided in windows of 250 bp each for the homologous DNA regions. Zones without windows indicate either interruptions in the concatenated PCR profile (as in Fig. 1) or indels containing more DNA in strain A. The color of each window indicates the extent of nucleotide differences as follows: white, no differences; yellow, 1 to 4 differences; orange, 5 to 10 differences; red, >10 differences. Indels were not counted as nucleotide differences. The middle line rows indicate the open reading frames (ORFs) common to both strains, following the annotation of strain A (10). Gray arrows show ORFs with similar annotations in both strains; black arrows indicate ORFs that correspond to pseudogenes in one of the strains. The top rows show the continuity of the homologous sequence between the two strains and the major genomic rearrangements that interrupt it. The absence of the solid line indicates regions where concatenation of PCR products was interrupted (see Fig. 1). Bars above the line indicate indels where strain A contains more DNA; bars below the line indicate indels where strain B contains more DNA; in this case, the right end of the bar indicates the position of the insertion according to the scale of strain A.

Similar articles

Cited by

References

    1. Achtman, M., G. Morelli, P. Zhu, T. Wirth, I. Diehl, B. Kusecek, A. J. Vogel, D. M. Wagner, C. J. Allender, W. R. Easterday, V. Chenal-Francisque, P. Worsham, N. R. Thomson, J. Parkhill, L. E. Lindler, E. Carniel, and P. Keim. 2004. Microevolution and history of the plague bacillus, Yersinia pestis. Proc. Natl. Acad. Sci. USA 101:17837-17842. - PMC - PubMed
    1. Anderson, R. P., and J. R. Roth. 1977. Tandem genetic duplications in phage and bacteria. Annu. Rev. Microbiol. 31:473-504. - PubMed
    1. Beattie, G. A., M. K. Clayton, and J. Handelsman. 1989. Quantitative comparison of the laboratory and field competitiveness of Rhizobium leguminosarum bv. phaseoli. Appl. Environ. Microbiol. 55:2755-2761. - PMC - PubMed
    1. D'hooghe, I., J. Michiels, K. Vlassak, C. Verreth, F. Walkens, and J. Venderleyden. 1995. Structural and functional analysis of the fixLJ genes of Rhizobium leguminosarum bv phaseoli CNPAF512. Mol. Gen. Genet. 249:117-126. - PubMed
    1. Feil, E. J. 2004. Small change: keeping pace with microevolution. Nat. Rev. Microbiol. 2:483-495. - PubMed

Publication types

Associated data

LinkOut - more resources