Comparative Study
. 2005 Nov;187(21):7292-308.
doi: 10.1128/JB.187.21.7292-7308.2005.

Whole-genome sequencing of staphylococcus haemolyticus uncovers the extreme plasticity of its genome and the evolution of human-colonizing staphylococcal species

Affiliations
Comparative Study

Whole-genome sequencing of staphylococcus haemolyticus uncovers the extreme plasticity of its genome and the evolution of human-colonizing staphylococcal species

Fumihiko Takeuchi et al. J Bacteriol. 2005 Nov.

Abstract

Staphylococcus haemolyticus is an opportunistic bacterial pathogen that colonizes human skin and is remarkable for its highly antibiotic-resistant phenotype. We determined the complete genome sequence of S.haemolyticus to better understand its pathogenicity and evolutionary relatedness to the other staphylococcal species. A large proportion of the open reading frames in the genomes of S.haemolyticus, Staphylococcus aureus, and Staphylococcus epidermidis were conserved in their sequence and order on the chromosome. We identified a region of the bacterial chromosome just downstream of the origin of replication that showed little homology among the species but was conserved among strains within a species. This novel region, designated the "oriC environ," likely contributes to the evolution and differentiation of the staphylococcal species, since it was enriched for species-specific nonessential genes that contribute to the biological features of each staphylococcal species. A comparative analysis of the genomes of S.haemolyticus, S.aureus, and S.epidermidis elucidated differences in their biological and genetic characteristics and pathogenic potentials. We identified as many as 82 insertion sequences in the S.haemolyticus chromosome that probably mediated frequent genomic rearrangements, resulting in phenotypic diversification of the strain. Such rearrangements could have brought genomic plasticity to this species and contributed to its acquisition of antibiotic resistance.


Figures
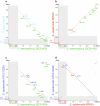
FIG. 1.
FIG. 1.
Homologous regions between pairs of staphylococcal chromosomes computed with BLASTN. DNA sequence homology between two staphylococcal species was computed with BLASTN and plotted as segmented lines. Regions with little homology between a pair of chromosomes appear as gaps between the lines. Large gaps are circled in red, and the corresponding elements (GIs or large orfs) found in the gaps are noted next to the circles (light blue, S.aureus N315; dark blue, S.epidermidis ATCC 12228; orange, S.epidermidis RP62A; green, S.haemolyticus JCSC1435). The area within the oriC environ of each chromosome where few matches were found between the species is shown in gray. Although the sequences were dissimilar, all three staphylococcal species possessed extra-large orfs (ebhA and -B in N315, SE1128 in ATCC 12228, and SH1471 in JCSC1435) in the corresponding locus near terC (see also Fig. 2b). Base-pair numbering of S.epidermidis RP62A sequence was adjusted to align it with the other sequences at oriC. Strains used for comparison: (a) JCSC1435 (horizontal axis) and N315 (vertical axis); (b) JCSC1435 (horizontal axis) and RP62A (vertical axis); (c) JCSC1435 (horizontal axis) and ATCC 12228 (vertical axis); and (d) RP62A (horizontal axis) and ATCC 12228 (vertical axis).
FIG.2.
FIG.2.
Distribution of homologs across the chromosomes of three staphylococcal species. (a) Left: fine phylogenetic classification and coloration. Homologs are classified phylogenetically into 17 classes in the Venn diagram according to their distribution among 10 strains of three Staphylococcus species. Each phylogenetic class is symbolized by a bar partitioned into five colored segments, and the number of homologs in the class is indicated. The top two segments are colored according to the distribution of the homologs among seven S.aureus strains—-common to all strains (topmost segment colored and the second segment in white), unique to some strains (top-most in white and second colored), or absent from the strains (both in white). The next two segments are colored based on the distribution among S.epidermidis strains—-common to two strains (third segment colored and fourth in white), unique to either strain (third in white and fourth colored), and absent from the strains (both in white). The bottommost segment is colored if S.haemolyticus strain JCSC1435 had the homolog (white, if otherwise). The coloration of the segments is changed according to phylogenetic classes: cyan for those unique to S.aureus, magenta if unique to S.epidermidis, yellow if unique to S.haemolyticus, and mixed if the homolog was shared by the species. Right: simple phylogenetic classification of homologs. The names of seven classes are as follows: SA, specific to S.aureus; SE, specific to S.epidermidis; SH, specific to S.haemolyticus; SASESH, common to all the three species; SASE, common to S.aureus and S.epidermidis; SASH, common to S.aureus and S.haemolyticus; and SESH, common to S.epidermidis and S.haemolyticus. (b) Localization of homologs across the chromosomes. The location of each homolog is denoted by the five-segmented bar colored according to its phylogenetic classification (see panel a). Related information is also given for each chromosome: row 1, transposases in blue bars and integrases in purple; row 2, pathogenic orfs in red bars; row 3, phylogenetically classified homologs; row 4, G+C content at the third codon (GC3) of each orf indicated by the height of the bar, anomalousness estimated by synonymous codon usage, and GC3 (22) indicated by the color (green, highly expressed; red, putative alien; yellow, possible alien; blue, others); row 5, genomic islands in red rectangles and the largest orfs in black. Regions with few black bars in row 3 are deficient in homologs of the SASESH class and correspond to regions possibly acquired by horizontal gene transfer. Distribution of a skewed GC3 and anomalous codon usage pattern is consistent with this view. The leftmost regions with shadowed background correspond to the oriC environs.
FIG. 3.
FIG. 3.
Correlation between phylogenetic and functional categories of the homologs distributed among three staphylococcal species and the functional properties of the oriC environ. The relative proportions of biological function (20) encoded by homologs of each of the seven phylogenetic classes (see Fig. 2a) are shown. Also shown is the comparison of function encoded by homologs located in the right part of oriC environ and those of the entire chromosome. Noted in the parentheses are the numbers of the homologs in a specific class, in a chromosome, or the number of orfs in the right part of an oriC environ. Species-specific orfs of unique function were enriched in the right part of the oriC environ of each species (see the legend to Fig. 2a for abbreviations).
FIG. 4.
FIG. 4.
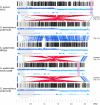
Large-scale chromosomal inversion and the possible involvement of the oriC environ in the process as suggested by a comparison of the distribution of the homologs common to the three staphylococcal species. For each strain, the homologs common to 10 strains of three Staphylococcus species (see Fig. 2a) are plotted as black segments of bars. Their heights represent the similarity in nucleotide sequence among the three species (the overall average was 78%). Below the drawing, the G-C skew [defined as (% G − % C)/(% G + % C)] for each 1-kbp window is shown in thick blue for positive and light blue for negative values. The regions of positive and negative G-C skew correspond to replichores 1 and 2, respectively. The oriC environ is shown in gray. The pink highlighted regions in the genomes of S.aureus N315 and S.epidermidis ATCC 12228 also contain few homologs common to staphylococci and likely represent remnants of the oriC that were translocated upstream of oriC by chromosomal inversion. The homologs present as single copies in each chromosome are connected by lines between adjacent chromosomes. The lines are in blue when the homologs are oriented the same relative to oriC and red when reversed. The black line indicates homologs located in diverse loci. When the chromosomes are inverted, the breakpoints of inversion (where blue and red lines meet on a chromosome) are circled in green. See Fig. 1 for the BLASTN plot for each pair of the chromosomes analyzed here.
FIG. 5.
FIG. 5.
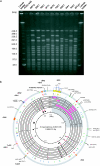
Spontaneous phenotypic mutants of S.haemolyticus JCSC1435 arose due to oriC environ rearrangement. (a) PFGE banding patterns of mutant strains compared with JCSC1435. (b) Circular representation of JCSC1435 chromosome and the deletions in the mutant strains 4IA1, 8GC1, 8HT4, 3DC1, and WP12. All of the deletions (circles 3 to 7) were within the oriC environ, shadowed in gray. Circles are described from the outside inward. Circle 1: horizontally acquired regions (yellow, SCC cluster and transposons; pink, prophages; blue, integrated plasmids; orange, other GIs); ISS (blue), and specific genes (red, drug resistance; yellow, ccrC; green, presumably related to aggregation or to biochemical properties examined in Table 6). Circle 2: ISs (yellow, IS431; red, IS256; green, ISSha1; blue, IS1272; purple, IS981-like and IS657-like). Circles 3 to 7: deletions indicated by light pink boxes. When a border of the region coincides with ISS or IS of JCSC1435, the border of the box is colored in accordance with that for the element denoted in the first or second circle. Fragmentations of the chromosomes are based on the SacII restriction sites used for PFGE. Circle 8: rRNA and its orientation (red arrowhead). Circle 9: tRNAs in black bars. Circle 10: nucleotide position (with clockwise increment starting from oriC).

References

    1. Altschul, S. F., W. Gish, W. Miller, E. W. Myers, and D. J. Lipman. 1990. Basic local alignment search tool. J. Mol. Biol. 215:403-410. - PubMed
    1. Baba, T., F. Takeuchi, M. Kuroda, T. Ito, H. Yuzawa, and K. Hiramatsu. 2004. The Staphylococcus aureus genome, p. 66-153. In D. Ala'Aladeen and K. Hiramatsu (ed.), Staphylococcus aureus—-molecular and clinical aspects. Harwood Publishing Limited, Chichester, United Kingdom.
    1. Baba, T., F. Takeuchi, M. Kuroda, H. Yuzawa, K. Aoki, A. Oguchi, Y. Nagai, N. Iwama, K. Asano, T. Naimi, H. Kuroda, L. Cui, K. Yamamoto, and K. Hiramatsu. 2002. Genome and virulence determinants of high virulence community-acquired MRSA. Lancet 359:1819-1827. - PubMed
    1. Bergey, D. H., and J. G. Holt. 1994. Bergey's manual of determinative bacteriology, 9th ed. Williams & Wilkins, Baltimore, Md.
    1. Centers for Disease Control and Prevention. 1999. Four pediatric deaths from community-acquired methicillin-resistant Staphylococcus aureus--Minnesota and North Dakota, 1997-1999. JAMA 282:1123-1125. - PubMed

Publication types

MeSH terms

Associated data