Comparative Study
. 2005 Oct 19;25(42):9567-80.
doi: 10.1523/JNEUROSCI.2992-05.2005.

Hippocampal CA1 circuitry dynamically gates direct cortical inputs preferentially at theta frequencies

Affiliations
Comparative Study

Hippocampal CA1 circuitry dynamically gates direct cortical inputs preferentially at theta frequencies

Chyze W Ang et al. J Neurosci. .

Abstract

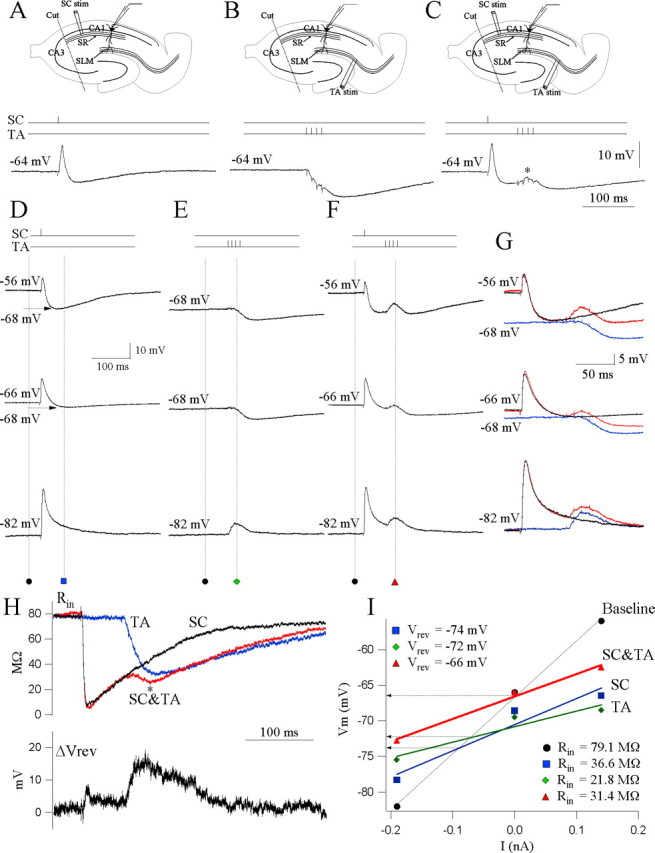
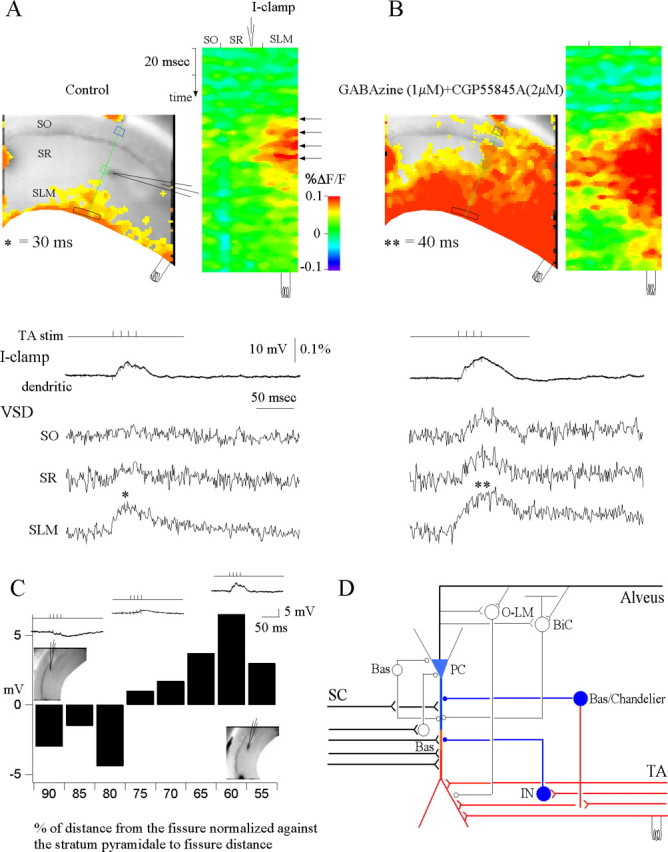
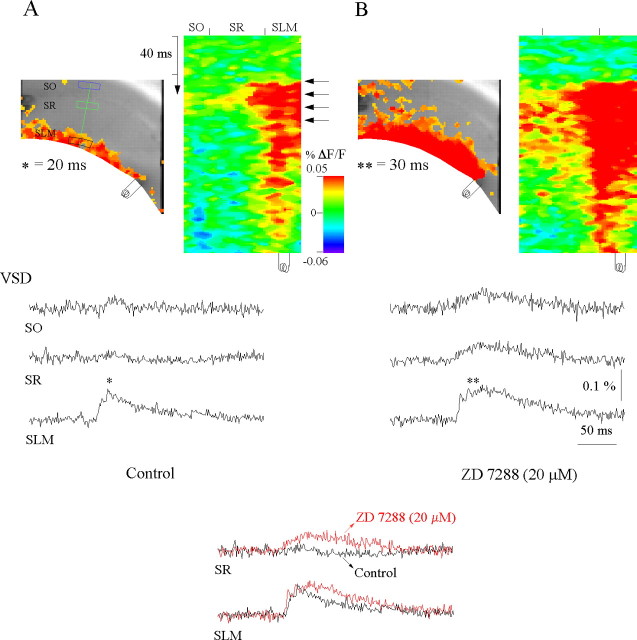
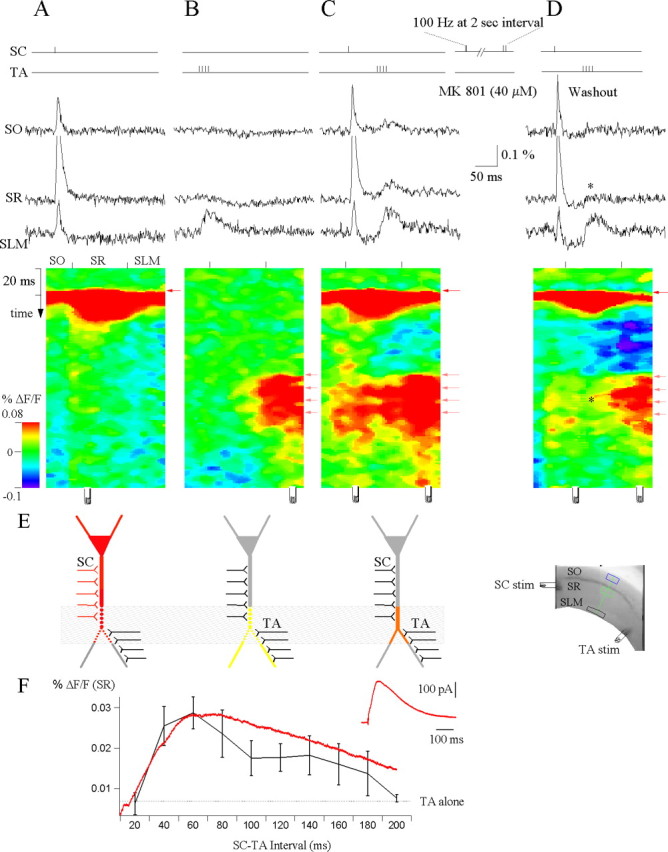
Hippocampal CA1 pyramidal neurons receive intrahippocampal and extrahipppocampal inputs during theta cycle, whose relative timing and magnitude regulate the probability of CA1 pyramidal cell spiking. Extrahippocampal inputs, giving rise to the primary theta dipole in CA1 stratum lacunosum moleculare, are conveyed by the temporoammonic pathway. The temporoammonic pathway impinging onto the CA1 distal apical dendritic tuft is the most electrotonically distant from the perisomatic region yet is critical in regulating CA1 place cell activity during theta cycles. How does local hippocampal circuitry regulate the integration of this essential, but electrotonically distant, input within the theta period? Using whole-cell somatic recording and voltage-sensitive dye imaging with simultaneous dendritic recording of CA1 pyramidal cell responses, we demonstrate that temporoammonic EPSPs are normally compartmentalized to the apical dendritic tuft by feedforward inhibition. However, when this input is preceded at a one-half theta cycle interval by proximally targeted Schaffer collateral activity, temporoammonic EPSPs propagate to the soma through a joint, codependent mechanism involving activation of Schaffer-specific NMDA receptors and presynaptic inhibition of GABAergic terminals. These afferent interactions, tuned for synaptic inputs arriving one-half theta interval apart, are in turn modulated by feedback inhibition initiated via axon collaterals of pyramidal cells. Therefore, CA1 circuit integration of excitatory inputs endows the CA1 principal cell with a novel property: the ability to function as a temporally specific "AND" gate that provides for sequence-dependent readout of distal inputs.


Figures

Figure 1.
Figure 1.
CA1 circuit integration of afferent inputs. A, Schaffer (SC) pathway stimulation. An example of a current-clamp somatic response to a single stimulus applied in stratum radiatum. The resting potential of the cell is -64 mV. The schematic shows the recording setup: one stimulating electrode is used to stimulate the Schaffer collaterals (SC). Somatic patch recording from CA1 pyramidal neurons records responses elicited by Schaffer stimulation. B, Temporoammonic (TA) pathway stimulation. Current-clamp response of the same cell to a burst of four stimuli at 100 Hz applied in stratum lacunosum moleculare. Note the inhibitory somatic response. Recording setup, One stimulating electrode is used to stimulate the temporoammonic axons (TA). Somatic patch recording from CA1 pyramidal neurons records responses elicited by temporoammonic stimulation. C, Schaffer-temporoammonic (SC&TA) pathway stimulation. Current-clamp response of the same cell to paired Schaffer and temporoammonic stimulation such that a single Schaffer stimulus precedes the temporoammonic burst stimulus by 60 ms. Note the integrated response recorded at the soma (asterisk). Similar results are obtained from 12 cells. Recording setup, Two stimulating electrodes are used, one to stimulate the Schaffer collaterals and the other to stimulate the temporoammonic axons (TA). Somatic patch recording from CA1 pyramidal neurons records responses elicited by the Schaffer-temporoammonic stimulation. D, Vm at rest (-68 mV) was displaced to depolarized (-56 mV, 0.14 nA) and hyperpolarized (-84 mV, -0.19 nA) levels by current injection. Recordings are from a different cell than that depicted in A-C. E, Responses to temporoammonic (TA) pathway stimulation at the three levels of Vm in the same cell as D. F, Integrated output of the soma to Schaffer-temporoammonic stimulation measured at three levels of Vm. G, Superimposed traces from D-F. Black, SC; blue, TA; red, SC&TA. H, Top, Calculated plots of the time continuous input resistance (Rin) throughout the synaptic response for the three stimulus conditions. Black, SC; blue, TA; red, SC&TA. Bottom, Calculated plot of the subtracted continuous Vrev. Note the depolarizing shift in Vrev during the Schaffer-gated temporoammonic response. I, I-V plot of the synaptic responses to Schaffer, temporoammonic, and Schaffer-temporoammonic stimulations. Measurements were made at baseline (square) and at the time point corresponding to the peak of the gating effect. Lines are the best linear fit to each set of points, and Rin (values indicated) is the slope of the line. Intersection of the lines with the baseline indicate the apparent reversal potential of the particular response.
Figure 2.
Figure 2.
Subthreshold membrane potential changes in the apical dendrites of CA1 pyramidal cell in stratum radiatum are closely correlated with the local voltage-sensitive dye signal. A, A schematic illustration of the optical setup used in the study. The voltage-sensitive dye signal is recorded with a CCD camera simultaneously with dendritic whole-cell recordings. I-clamp, Current clamp; HEC, hippocampal-entorhinal cortical slice. B, The current-clamp dendritic recording in response to a single stimulus applied in stratum radiatum is superimposed onto the local voltage-sensitive dye signal quantified from a region of interest near the recording electrode in stratum radiatum. Changes in the membrane potential of the CA1 apical dendrite appear to be closely correlated with the voltage-sensitive dye signal, which presumably results from dendritic activity of many CA1 pyramidal neurons. C, For the recordings shown in B, changes in the local voltage-sensitive dye fluorescence are plotted as a function of the changes in membrane potential of the CA1 apical dendrite. The two measurements are correlated linearly with a linear correlation coefficient of r = 0.95. D, Residuals of the linear fit in C fitted to the function plotted as changes in the local voltage-sensitive dye fluorescence against the changes in membrane potential of the CA1 apical dendrite indicate that there is no systematic variability in the voltage-sensitive dye signal not accounted for by the change in dendritic membrane potential recorded with the patch electrode. The voltage-sensitive dye signals were averaged over 12 trials. E, Summary data of all current-clamp recordings (n = 18) in which each current-clamp recording having a 10 mV change in membrane voltage from the baseline is plotted as a function of the local voltage-sensitive dye responses. Bin width is 0.025% ΔF/F.
Figure 3.
Figure 3.
Feedforward GABAA-mediated inhibition activated via temporoammonic pathway stimulation spatially restricts evoked EPSPs to the distal dendrites of the CA1 pyramidal neurons. A, Control. A snapshot of activation at 30 ms of the voltage-sensitive dye (VSD) responses of evoked EPSPs (denoted by asterisk) to a burst stimulus (4 stimuli at 100 HZ) in stratum lacunosum moleculare (left) and the activation profile (right) generated from the raster line scan along the path of interest (green line) (see Materials and Methods). The location of the patch recording electrode is depicted in both the snapshot and raster scan images by the electrode graphic. Top trace, Current-clamp (I-clamp) dendritic shows the simultaneous whole-cell recording from the apical dendrite of a CA1 pyramidal cell in stratum radiatum. VSD SO, SR, and SLM are the local voltage-sensitive dye signals quantified from regions of interest in stratum oriens (blue box), stratum radiatum (green box), and stratum lacunosum moleculare (black box), respectively. The voltage-sensitive dye signals were averaged over 12 trials. Note that the temporoammonic-evoked EPSP is spatially restricted to the extreme distal dendrites of CA1 pyramidal neurons. B, Effects of the GABAA antagonist gabazine (1 μm) and the GABAB antagonist CGP 55845A (2 μm). Left, Snapshot at 40 ms. Note that the blockade of GABAergic inhibition results in loss of spatial segregation of the temporoammonic EPSPs in stratum lacunosum moleculare and significant propagation of temporoammonic EPSPs to stratum radiatum and stratum oriens (n = 4). C, Plot of the current-clamp dendritic whole-cell recordings along the somatodendritic axis of the CA1 pyramidal neuron in response to a burst stimulus in stratum lacunosum moleculare, as a function of the normalized distance of the patch electrode from the hippocampal fissure to stratum pyramidale. Insets show the relative current-clamp dendritic specimen records and locations of the patch electrode. Note that temporoammonic-evoked IPSPs are prevalent in recordings close to the cell somata, whereas EPSPs are prevalent in recordings from more distal dendrites. D, Schematic of the CA1 local circuitry showing the response to temporoammonic stimulation. Red represents excitation and blue represents inhibition. SC, Schaffer collateral; TA, temporoammonic pathway; PC, pyramidal cell; O-LM, oriens-lacunosum-moleculare interneuron; BiC, bistratified cell; Bas, basket cell; Chandelier, chandelier cell; IN, interneuron.
Figure 4.
Figure 4.
Intrinsic Ih properties spatially restrict propagation of temporoammonic EPSPs. A, Control. A snapshot of activation at 20 ms of the voltage-sensitive dye (VSD) responses of evoked EPSPs (asterisk) to a burst stimulus (4 stimuli at 100 HZ) in stratum lacunosum moleculare (left) and the activation profile (right) generated from the raster line scan along the path of interest (green line) (see Materials and Methods). VSD SO, SR, and SLM are the local voltage-sensitive dye signals quantified from regions of interest in stratum oriens (blue box), stratum radiatum (green box), and stratum lacunosum moleculare (black box), respectively. The voltage-sensitive dye signals were averaged over 12 trials. Note that the temporoammonic-evoked EPSP is spatially restricted to the extreme distal dendrites of CA1 pyramidal neurons. B, Perfusion of the Ih antagonist ZD 7288 (20 μm) results in significant facilitation of temporoammonic EPSPs to stratum radiatum and stratum oriens (**p ≤ 0.05, ANOVA; n = 4). Left, Snapshot at 40 ms. The inset compares the voltage-sensitive dye responses in stratum lacunosum moleculare and stratum radiatum in control (black) and in the presence of ZD 7288 (red).
Figure 5.
Figure 5.
Circuit integration: activation of NMDA receptors gates temporoammonic EPSPs. A, Schaffer (SC) pathway stimulation. Top trace, Current-clamp (I-clamp) dendritic shows the simultaneous whole-cell recording from the apical dendrite of a CA1 pyramidal cell in response to a single stimulus applied in stratum radiatum. VSD SO, SR, and SLM are the local voltage-sensitive dye (VSD) signals quantified from regions of interest in stratum oriens (blue box), stratum radiatum (green box), and stratum lacunosum moleculare (black box), respectively (see grayscale image in inset). The activation profile image, generated from the raster line scan along the path of interest (green line), shows the spatiotemporal response to a Schaffer collateral stimulus that returns to baseline and does not exhibit prolonged depolarization in stratum radiatum during the time window in which the temporoammonic pathway is activated. SC, Schaffer collateral stimulation; TA, temporoammonic stimulation. The location of the patch recording and stimulating electrodes are schematically depicted by graphics above and below the raster scan, respectively. The voltage-sensitive dye signals were averaged over 12 trials. Alv stim, Alveus stimulation. B, Temporoammonic (TA) pathway stimulation. Note that the voltage-sensitive dye response is spatially restricted to the apical tuft in stratum lacunosum moleculare, and the current-clamp dendritic recording of a CA1 pyramidal neuron apical dendrite in stratum radiatum shows an inhibitory response. C, Schaffer-temporoammonic (SC&TA) pathway stimulation. The Schaffer and temporoammonic stimulus are paired so that a single Schaffer stimulus precedes the temporoammonic burst stimulus by 40 ms. With the previous Schaffer stimulus, the temporoammonic inputs integrate synergistically and propagate to stratum radiatum and stratum oriens. The asterisk denotes gating of temporoammonic EPSPs to stratum radiatum and stratum oriens (n = 9). D, Schaffer-temporoammonic pathway stimulation (SC&TA) with the NMDA receptor antagonist AP-5 (50 μm). In the presence of AP-5, the Schaffer and temporoammonic stimulus are paired so that a single Schaffer stimulus precedes the temporoammonic burst stimulus by 40 ms. AP-5 significantly blocks the gating of temporoammonic EPSPs to stratum radiatum and stratum oriens (**p = 0.05; ANOVA; n = 4).
Figure 6.
Figure 6.
NMDA receptors specific to stratum radiatum mediate propagation of temporoammonic EPSPs. A, Schaffer (SC) pathway stimulation. VSD SO, SR, and SLM are the local voltage-sensitive dye (VSD) signals quantified from regions of interest in stratum oriens (blue box), stratum radiatum (green box), and stratum lacunosum moleculare (black box), respectively (see grayscale image in inset). The activation profile image, generated from the raster scan of the path of interest (green line), shows the spatiotemporal response to the Schaffer collateral stimulus that returns to baseline and does not exhibit prolonged depolarization in stratum radiatum during the time window in which the temporoammonic (TA) pathway is activated. Site of the stimulation electrode is depicted below the raster scans, respectively. The voltage-sensitive dye signals were averaged over 12 trials. B, Temporoammonic (TA) pathway stimulation. Note that the voltage-sensitive dye signal revealed an inhibitory response in stratum radiatum and is compartmentalized to the apical tuft in stratum lacunosum moleculare. C, Schaffer-temporoammonic (SC&TA) pathway stimulation. The Schaffer and temporoammonic stimulus are paired so that a single Schaffer stimulus precedes the temporoammonic burst stimulus by 60 ms. Propagation of temporoammonic EPSPs is gated to stratum radiatum and stratum oriens. To preblock the NMDA receptors in stratum radiatum, the Schaffer collaterals are stimulated with a paired stimulus at 100 Hz every 2 s for 10 min in the presence of the use-dependent NMDA antagonist MK 801 (40 μm). D, Schaffer-temporoammonic (SC&TA) pathway stimulation. After washout of MK 801, the Schaffer-specific NMDA receptors remain blocked, and now the Schaffer-temporoammonic stimulation showed that gating of EPSPs to stratum radiatum and stratum oriens are significantly suppressed (*p = 0.05; ANOVA; n = 3). E, Diagram indicating the dendritic compartments of a neuron activated by (from left to right) Schaffer collateral, temporoammonic, and Schaffer-temporoammonic pathway stimulation. The shaded box indicates the overlapping compartments that are both activated by Schaffer stimulation and subsequently depolarized by temporoammonic activity, thereby leading to unblocking of NMDA receptors in these overlapping regions. F, Temporoammonic throughput as a function of Schaffer-temporoammonic interval. Voltage-sensitive dye responses from stratum radiatum were quantified from a region of interest in stratum radiatum for different intervals in which Schaffer collateral stimulus precedes temporoammonic stimulation (n = 7). Superimposed (red) is the voltage-clamp recording of the Schaffer collateral-activated NMDA EPSC from the CA1 apical dendrite held at +40 mV and isolated using the pharmacological scheme containing 1 μm gabazine and 10 μm DNQX (n = 3). Note that the largest voltage-sensitive dye response was obtained when the Schaffer-temporoammonic interval lies between 40 and 60 ms, and this corresponds to the peak of the NMDA EPSC. The inset shows the Schaffer collateral-activated NMDA EPSC (n = 3) from the CA1 apical dendrite held at +40 mV.
Figure 7.
Figure 7.
Presynaptic GABAB inhibition mediates propagation of temporoammonic EPSPs. A, Temporoammonic (TA) pathway stimulation. The activation profile image, generated from the raster scan of the path of interest, shows the spatiotemporal response to the TA burst stimulus. Note that the voltage-sensitive dye (VSD) signal revealed an inhibitory response in SR, whereas the excitatory response is compartmentalized to the apical tuft in SLM. SC, Schaffer collateral stimulation; TA, TA stimulation. The voltage-sensitive dye signals were averaged over 12 trials. B, Schaffer (SC) pathway stimulation. The activation profile image shows the spatiotemporal response to the Schaffer collateral stimulus that returns to baseline and does not exhibit prolonged depolarization in stratum radiatum during the time window in which the TA pathway is activated. C, Schaffer-temporoammonic (SC&TA) pathway stimulation. The Schaffer and temporoammonic stimulus are paired so that a single Schaffer stimulus precedes the temporoammonic burst stimulus by 60 ms. The propagation of temporoammonic EPSPs are gated to stratum radiatum and stratum oriens (asterisk). Temporoammonic (TA) pathway (D) and Schaffer (SC) (E) stimulation in the presence of the GABAB antagonist CGP 55845A (2 μm). Note the appearance of a late depolarizing component. F, Schaffer-temporoammonic (SC&TA) pathway stimulation in the presence of GABAB antagonist CGP 55845A (2 μm). CGP 55845A significantly blocks the gating of temporoammonic EPSPs to stratum radiatum and stratum oriens (**p = 0.05; ANOVA; n = 4).
Figure 8.
Figure 8.
Resegregation of afferent pathways integration by alvear-evoked feedback inhibition. A, Schaffer (SC) pathway stimulation. Top trace, Current clamp (I-clamp) dendritic shows the simultaneous whole-cell recording from the apical dendrite of a CA1 pyramidal cell in response to a single stimulus applied in the stratum radiatum. VSD SO, SR, and SLM are the local voltage-sensitive dye (VSD) signals quantified from regions of interest in stratum oriens (blue box), stratum radiatum (green box), and stratum lacunosum moleculare (black box), respectively (see grayscale image in inset). The activation profile image, generated from the raster scan of the path of interest (green line), shows the spatiotemporal response to the Schaffer collateral stimulus that returns to baseline and does not exhibit prolonged depolarization in stratum radiatum during the time window in which the TA pathway is activated. SC, Schaffer collateral stimulation; TA, temporoammonic stimulation; alveus, alveus stimulation. Sites of the patch electrode recording and stimulation are depicted by graphics above and below the raster scans, respectively. The voltage-sensitive dye signals were averaged over 12 trials. B, Temporoammonic (TA) pathway stimulation. Note that the voltage-sensitive dye response is spatially restricted to the apical tuft in stratum lacunosum moleculare, and the current-clamp dendritic recording of a CA1 pyramidal neuron apical dendrite in stratum radiatum shows an inhibitory response. C, Alveus stimulation evokes feedback inhibition. Note the inhibition evoked in both the dendritic patch recording and the voltage-sensitive dye signals obtained from regions of interest in stratum oriens (blue box) and stratum radiatum (green box) with a single alveus stimuli. (In the activation profile image, blue denotes hyperpolarization.) D, Schaffer-temporoammonic (SC&TA) pathway stimulation. The Schaffer and temporoammonic stimulus are paired so that a single Schaffer stimulus precedes the temporoammonic burst stimulus by 40 ms. The propagation of temporoammonic EPSPs are gated to stratum radiatum and stratum oriens (asterisk). E, Schaffer-alveus-temporoammonic (SC&alveus&TA) pathway stimulation. The Schaffer, alveus, and temporoammonic stimulus are paired so that a single Schaffer stimuli precedes the alveus stimulation by 30 ms, which precedes the temporoammonic burst stimulus by 10 ms. Unlike the expansion of activity in D, here the pathway interactions are resegregated by the alvear-evoked feedback inhibition (double asterisks; n = 9). F, Comparisons of the current-clamp whole-cell dendritic recordings in stratum radiatum for temporoammonic (TA, black), Schaffer-temporoammonic (SC&TA, red), and Schaffer-alveus-temporoammonic (SC&alveus&TA, blue) stimulation.
Figure 9.
Figure 9.
Summary data of the Schaffer and temporoammonic pathway interactions and resegregation by alvear-evoked feedback inhibition. A, Summary data on the response in SO. The asterisk indicates significant temporoammonic (TA) throughput (*p ≤ 0.05, ANOVA; n = 9). B, Summary data on the response in SR. Single asterisk indicates significant temporoammonic (TA) throughput (*p ≤ 0.05, ANOVA; n = 9). C, Summary data on the response in SLM. There is no significant difference in stratum lacunosum moleculare responses between the temporoammonic and Schaffer-temporoammonic (SC&TA) stimulation protocols. D, Summary data on the response from Schaffer-temporoammonic stimulation in the presence of AP-5 (50 μm) (left), in the presence of CGP 55845A (2 μm) (center), and the response from Schaffer-alveus-temporoammonic (SC&Alv&TA) stimulation (right) in stratum oriens. There is no significant difference between the responses to Schaffer-temporoammonic (AP-5) and the arithmetic sum of the individual Schaffer (SC) and temporoammonic response (black), indicating that supralinear summation of Schaffer and temporoammonic inputs require activation of NDMA receptors (**p ≤ 0.05, ANOVA; n = 9). There is a significant difference between the responses to Schaffer-temporoammonic (CGP 55845A) and Schaffer-temporoammonic stimulation, indicating that presynaptic disinhibition significantly gates temporoammonic throughput to SO (***p ≤ 0.05, ANOVA; n = 9). There is a significant difference between the responses to Schaffer-temporoammonic and Schaffer-alveus-temporoammonic stimulation, indicating that feedback inhibition significantly suppresses temporoammonic throughput to SO (****p≤ 0.05, ANOVA; n = 9). E, Summary data on the response from Schaffer-temporoammonic stimulation in the presence of AP-5 (50 μm) (left), in the presence of CGP 55845A (2 μm) (center), and the response from Schaffer-alveus-temporoammonic stimulation (right) in stratum radiatum. There is no significant difference between the responses to Schaffer-temporoammonic (AP-5) and the arithmetic sum of the individual Schaffer and temporoammonic response (black) (**p ≤ 0.05, ANOVA; n = 9). There is a significant difference between the responses to Schaffer-temporoammonic (CGP 55845A) and Schaffer-temporoammonic stimulation, indicating that presynaptic disinhibition significantly gates temporoammonic throughput to SR (***p ≤ 0.05, ANOVA; n = 9). There is significant difference between the responses to Schaffer-temporoammonic and Schaffer-alveus-temporoammonic stimulation, indicating that feedback inhibition significantly suppresses temporoammonic throughput to SR (****p≤ 0.05, ANOVA; n = 9). F, Summary data on the response from Schaffer-temporoammonic stimulation in the presence of AP-5 (50 μm) (left), in the presence of CGP 55845A (2 μm) (center), and the response from Schaffer-alveus-temporoammonic stimulation (right) in stratum lacunosum moleculare. There is no significant difference between the responses to Schaffer-temporoammonic (AP-5) and the arithmetic sum of the individual Schaffer and temporoammonic response (black). There is no significant difference between the responses to Schaffer-temporoammonic (CGP 55845A) and Schaffer-temporoammonic stimulation. There is no significant difference between the responses to Schaffer-temporoammonic and Schaffer-alveus-temporoammonic stimulation.

Similar articles

Cited by

References

    1. Blanton MG, LoTurco JJ, Kriegstein AR (1989) Whole cell recording from neurons in slices of reptilian and mammalian cerebral cortex. J Neurosci Methods 30: 203-210. - PubMed
    1. Blasco-Ibáñez JM, Freund TF (1995) Synaptic input of horizontal interneurons in stratum oriens of the hippocampal CA1 subfield: structural basis of feed-back activation. Eur J Neurosci 7: 2170-2180. - PubMed
    1. Brankack J, Stewart M, Fox SE (1993) Current source density analysis of the hippocampal theta rhythm: associated sustained potentials and candidate synaptic generators. Brain Res 615: 310-327. - PubMed
    1. Brun VH, Otnæss MK, Molden S, Steffenach HA, Witter MP, Moser MB, Moser EI (2002) Place cells and place recognition maintained by direct entorhinal-hippocampal circuitry. Science 296: 2243-2246. - PubMed
    1. Buzsáki G (2002) Theta oscillations in the hippocampus. Neuron 33: 325-340. - PubMed

Publication types

LinkOut - more resources