Comparative Study
. 2005 Oct 19;25(42):9581-90.
doi: 10.1523/JNEUROSCI.2423-05.2005.

The translation repressor 4E-BP2 is critical for eIF4F complex formation, synaptic plasticity, and memory in the hippocampus

Affiliations
Comparative Study

The translation repressor 4E-BP2 is critical for eIF4F complex formation, synaptic plasticity, and memory in the hippocampus

Jessica L Banko et al. J Neurosci. .

Abstract

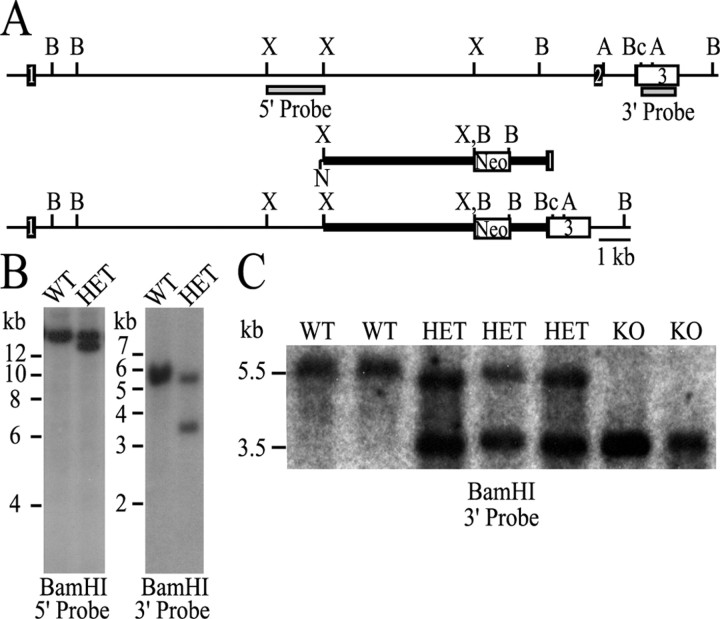
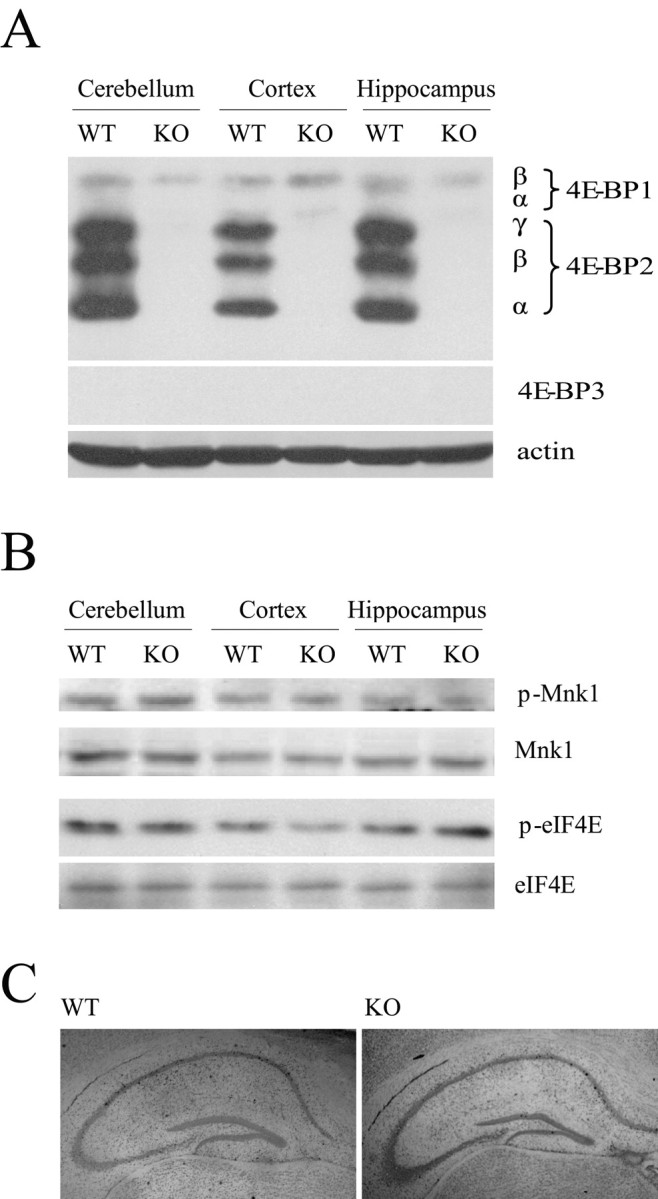
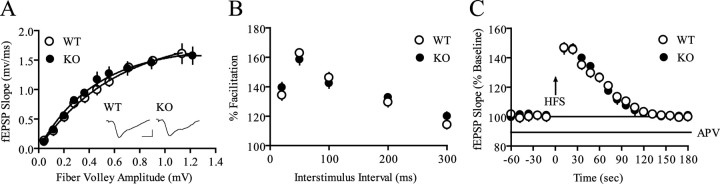
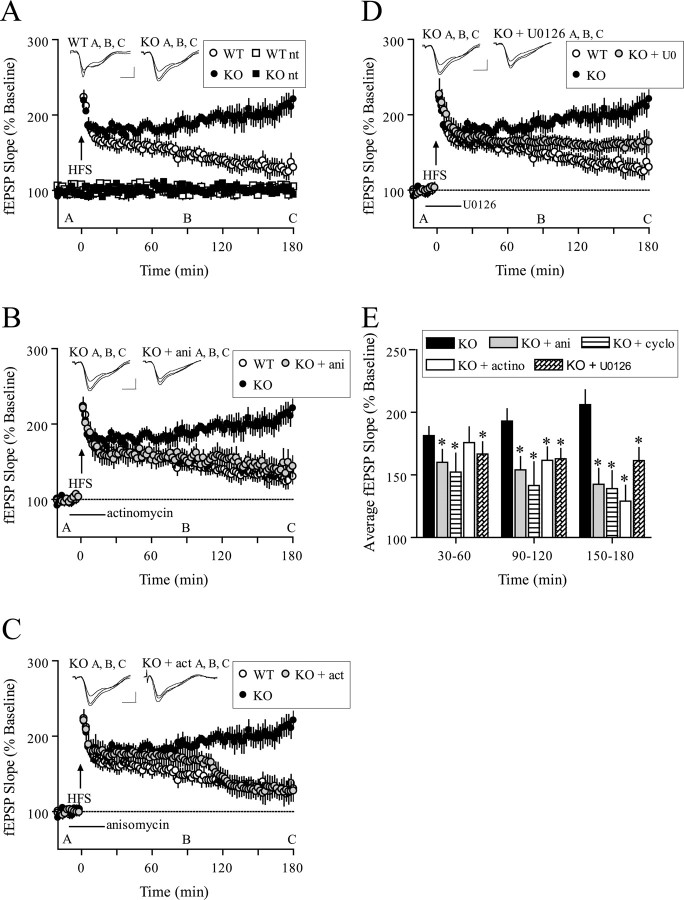
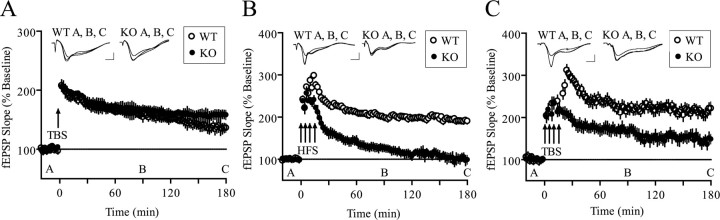
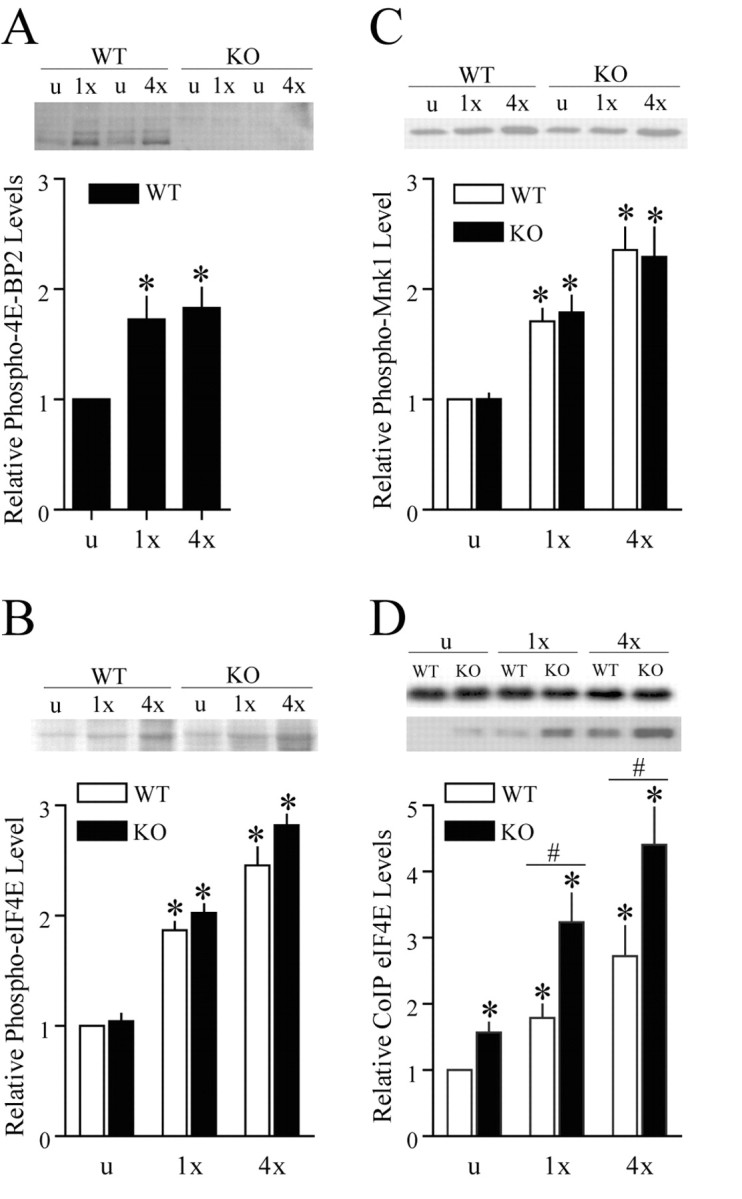
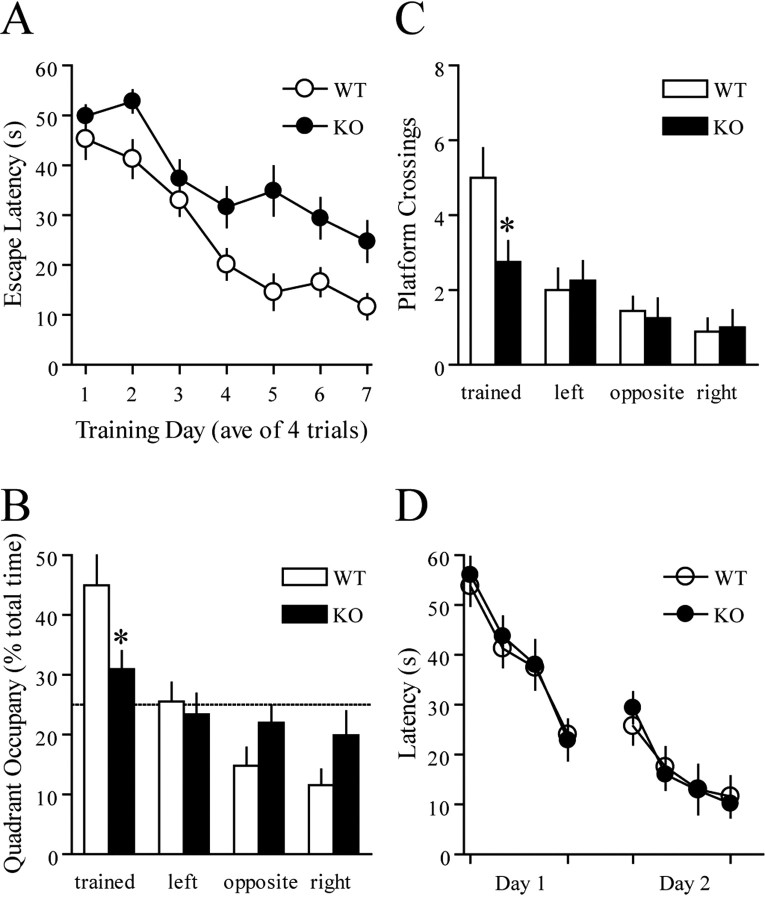
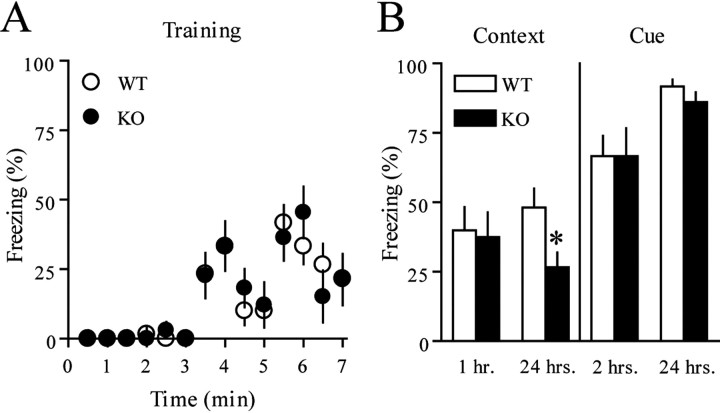
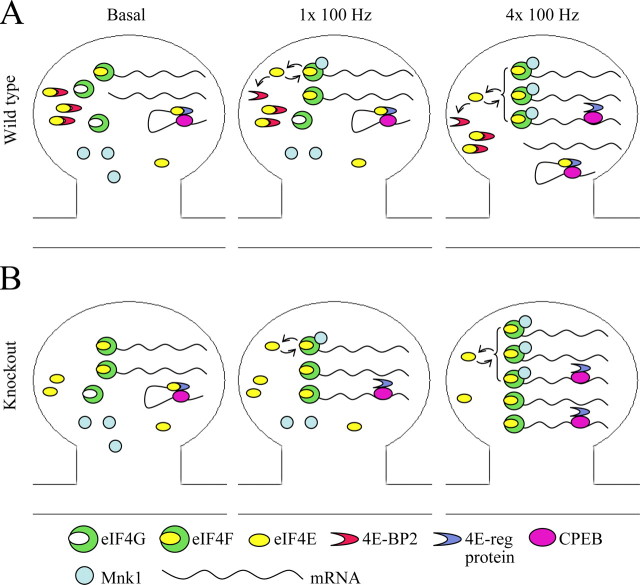
Long-lasting synaptic plasticity and memory requires mRNA translation, yet little is known as to how this process is regulated. To explore the role that the translation repressor 4E-BP2 plays in hippocampal long-term potentiation (LTP) and learning and memory, we examined 4E-BP2 knock-out mice. Interestingly, genetic elimination of 4E-BP2 converted early-phase LTP to late-phase LTP (L-LTP) in the Schaffer collateral pathway, likely as a result of increased eIF4F complex formation and translation initiation. A critical limit for activity-induced translation was revealed in the 4E-BP2 knock-out mice because L-LTP elicited by traditional stimulation paradigms was obstructed. Moreover, the 4E-BP2 knock-out mice also exhibited impaired spatial learning and memory and conditioned fear-associative memory deficits. These results suggest a crucial role for proper regulation of the eIF4F complex by 4E-BP2 during LTP and learning and memory in the mouse hippocampus.


Figures

Figure 1.
Figure 1.
Targeted disruption of Eif4ebp2. A, Schematic representation of the mouse Eif4ebp2 gene (top), targeting vector (middle), and targeted gene (bottom). The coding region of exons 1 and 2 is displayed as a dark box, and the 3′ untranslated region is displayed as an open box. A neomycin (Neo) transferase expression cassette was substituted for the Eif4ebp2 XbaI-BclI fragment. A, B, Bc, N, and X indicate the AflIII, BamHI, BclI, NotI, and XbaI restriction enzyme sites, respectively. Not all AflIII and BclI sites are shown. B, Southern blot analysis of wild-type and Eif4ebp2-targeted ES cell clones using the 5′ and 3′ probes depicted as gray boxes in A. C, Southern blot analysis of wild-type, Eif4ebp2-targeted, and homozygous knock-out mice with the 3′ probe. WT, Wild type; HET, Eif4ebp2 targeted; KO, knock-out.
Figure 2.
Figure 2.
General characterization of 4E-BP2 knock-out mice. A, Representative Western blot analysis of 4E-BP1, 4E-BP2, 4E-BP3, and actin in different brain regions obtained from wild-type or knock-out mice. α, β, and γ identify 4E-BP1 and 4E-BP2 phosphorylation isoforms that exhibit different electrophoretic mobilities in SDS-PAGE. B, Representative Western blot analysis of phosphorylated and total protein levels of eIF4E and Mnk1 in different brain regions show no difference. C, Representative cresyl violet staining of hippocampal cell bodies in slices obtained from wild-type (left) and knock-out (right) mice show no difference. WT, Wild type; KO, knock-out.
Figure 3.
Figure 3.
Basal synaptic transmission and short-term plasticity are normal in 4E-BP2 knock-out mice. A, Input-output relationships of wild-type (WT) and knock-out (KO) mice show no difference with nonlinear regression (zero to top) analysis of the fEPSP slopes evoked with increasing stimulation versus their companion fiber volley amplitude (n = 39 slices; 22 mice per genotype; p > 0.05). Representative fEPSP traces evoked at 40% maximum stimulation are shown. Calibration: 1 mV, 10 ms. B, PPF is unaltered in knock-out mice. The percent of facilitation, calculated from the ratio of the second fEPSP slope to the first fEPSP slope, is shown at interpulse intervals ranging from 20 to 300 ms (n = 39 slices; 22 mice per genotype; p > 0.05). C, PTP after a single 100 Hz train (1 s) delivered in the presence of APV (50 μm) was unaltered in knock-out slices (n = 6 slices; 4 mice per genotype; p > 0.05).
Figure 4.
Figure 4.
Facilitated L-LTP in 4E-BP2 knock-out mice. A, A single 100 Hz train (1 s) evoked E-LTP in wild-type slices that decayed to baseline after 3 h but evoked L-LTP in knock-out slices that endured for at least 3 h (n = 10 slices; 8 mice per genotype; p < 0.0001; ANOVA). Representative fEPSP recordings from time points A, B, and C are shown for each condition. Calibration: 1 mV, 10 ms. B, Facilitated LTP induced by one 100 Hz train in knock-out slices was reversed by anisomycin (ani; 40 μm) after 45 min to a level indiscernible from wild-type slices (wild-type, n = 10; knock-out, n = 10; KO + ani, n = 8; p < 0.0001; ANOVA). C, Facilitated LTP induced by one 100 Hz train in knock-out slices was reversed by actinomycin-D (actino; 40 μm) after 90 min to a level indiscernible from wild-type slices (wild-type, n = 10; knock-out, n = 10; KO + actino, n = 8; p < 0.0001; ANOVA). D, Facilitated L-LTP-induced 100 Hz train in knock-out slices was attenuated by U0126 (20 μm) (wild-type, n = 10; knock-out, n = 10; KO + U0126, n = 8; p < 0.0001; ANOVA). E, Compilation bar graph depicting average fEPSP slopes for the time periods indicated. *p < 0.05 (t test) compared with knock-out for the given time periods. WT, Wild-type; KO, knock-out.
Figure 5.
Figure 5.
L-LTP-inducing stimuli evoke altered LTP in 4E-BP2 knock-out mice. A, TBS-induced LTP is similiar in knock-out and wild-type slices (n = 8 slices; 8 mice per genotype; p > 0.05; ANOVA). Representative fEPSP recordings from time points A, B, and C are shown for each condition. Calibration: 1 mV, 10 ms. B, Four 100 Hz trains (1 s) separated by 5 min each evoked L-LTP in wild-type slices that endured for at least 3 h but did not evoke L-LTP in knock-out slices (n = 10 slices; 8 mice per genotype; p < 0.0001; ANOVA). C, Four trains of TBS separated by 5 min each evoked a robust L-LTP in wild-type slices but not in knock-out slices (n = 8 slices; 8 mice per genotype; p < 0.0001; ANOVA). WT, Wild-type; KO, knock-out.
Figure 6.
Figure 6.
Regulation of translation initiation factors during LTP. A, HFS-induced 4E-BP2 phosphoryation (Thr36/47) in area CA1 homogenates obtained from wild-type and knock-out slices (n = 4 slices per genotype). *p < 0.05 (t test) compared with wild type unstimulated. Total protein loading was normalized by Ponceau S membrane staining. B, HFS-induced eIF4E phosphorylation (Ser 209) in area CA1 homogenates obtained from wild-type and knock-out slices (n = 6 slices per genotype). *p < 0.05 (t test) compared with wild type unstimulated. Total protein loading was normalized by Ponceau S membrane staining. C, HFS-induced Mnk1 phosphorylation (Thr100/220) in area CA1 homogenates obtained from wild-type and knock-out slices (n = 6 slices per genotype). *p < 0.05 (t test) compared with wild type unstimulated. Total protein loading was normalized by Ponceau S membrane staining. D, HFS-induced eIF4E-eIF4G coimmunoprecipitation in area CA1 homogenates obtained from wild-type and knock-out slices (n = 6 slices per genotype). *p < 0.05 (t test) compared with wild type unstimulated; #p < 0.05 (t test) between samples indicated by the bar. WT, Wild-type; KO, knock-out.
Figure 7.
Figure 7.
Impaired spatial learning and memory in 4E-BP2 knock-out mice. A, Escape latencies in the hidden platform Morris water maze plotted as a function of training day (n = 12 mice per genotype; p < 0.0001; ANOVA). B, The mean proportion of time spent in each of the quadrants during the probe test represented for both groups. C, The mean number of platform location crossings during the probe trial shown for the training quadrant and the corresponding locations in other quadrants. D, Cued-platform control task (n = 8 mice per genotype; p > 0.05; ANOVA). WT, Wild-type; KO, knock-out.
Figure 8.
Figure 8.
Impaired conditioned fear memory in 4E-BP2 knock-out mice. A, Wild-type (n = 22) and knock-out (n = 20) mice responded comparably during training with a paradigm of a tone paired with a footshock between 3-4 and 5-6 min. B, Mean freezing behavior is shown from the contextual fear response test performed 1 h (wild-type, n = 10; knock-out, n = 8) or 24 h (wild-type, n = 12; knock-out, n = 10) after training (*p < 0.05; Student's t test). Mean freezing behavior is shown from the cued fear response test performed 2 h (wild-type, n = 10; knock-out, n = 8) or 24 h (wild-type, n = 12; knock-out, n = 10) after training. WT, Wild-type; KO, knock-out.
Figure 9.
Figure 9.
A molecular model for activity-induced translation initiation. A, One 100 Hz train stimulation elicits E-LTP in wild-type mice, a process that does not require protein synthesis but engages translation initiation factors. eIF4E availability for eIF4G binding and eIF4F complex formation increases as a result of 4E-BP2 phosphorylation. eIF4G-bound eIF4E is phosphorylated by Mnk1 and can be reused for initiation or recovered by 4E-BP2. Four 100 Hz trains elicit L-LTP in wild-type mice, a process that requires mRNA production and protein synthesis. L-LTP results in more robust activation of the translation initiation factors, including release of eIF4E from additional 3′ cis-acting eIF4E-regulatory proteins. B, In 4E-BP2 knock-out mice, the basal levels of the eIF4F complex are elevated, lowering the threshold for elicitation of L-LTP. L-LTP elicited by four 100 Hz trains is obstructed by excessive formation of the eIF4F complex.

Similar articles

Cited by

References

    1. Abel T, Nguyen PV, Barad M, Deuel TA, Kandel ER, Bourtchouladze R (1997) Genetic demonstration of a role for PKA in the late phase of LTP and in hippocampus-based long-term memory. Cell 88: 615-626. - PubMed
    1. Alarcon JM, Hodgman R, Theis M, Huang YS, Kandel ER, Richter JD (2004) Selective modulation of some forms of Schaffer collateral-CA1 synaptic plasticity in mice with a disruption of the CPEB-1 gene. Learn Mem 11: 318-327. - PMC - PubMed
    1. Atkins CM, Nozaki N, Shigeri Y, Soderling TR (2004) Cytoplasmic polyadenylation element binding protein-dependent protein synthesis is regulated by calcium/calmodulin-dependent protein kinase II. J Neurosci 24: 5193-5201. - PMC - PubMed
    1. Banko JL, Hou L, Klann E (2004) NMDA receptor activation results in PKA- and ERK-dependent Mnk1 activation and increased eIF4E phosphorylation in hippocampal area CA1. J Neurochem 91: 462-470. - PubMed
    1. Barco A, Alarcon JM, Kandel ER (2002) Expression of constitutively active CREB protein facilitates the late phase of long-term potentiation by enhancing synaptic capture. Cell 108: 689-703. - PubMed

Publication types

Substances