Comparative Study
. 2005 Oct 19;25(42):9613-23.
doi: 10.1523/JNEUROSCI.1488-05.2005.

Differential maturation of GABA action and anion reversal potential in spinal lamina I neurons: impact of chloride extrusion capacity

Affiliations
Comparative Study

Differential maturation of GABA action and anion reversal potential in spinal lamina I neurons: impact of chloride extrusion capacity

Matilde Cordero-Erausquin et al. J Neurosci. .

Erratum in

  • J Neurosci. 2005 Nov 9;25(45):10574-5

Abstract

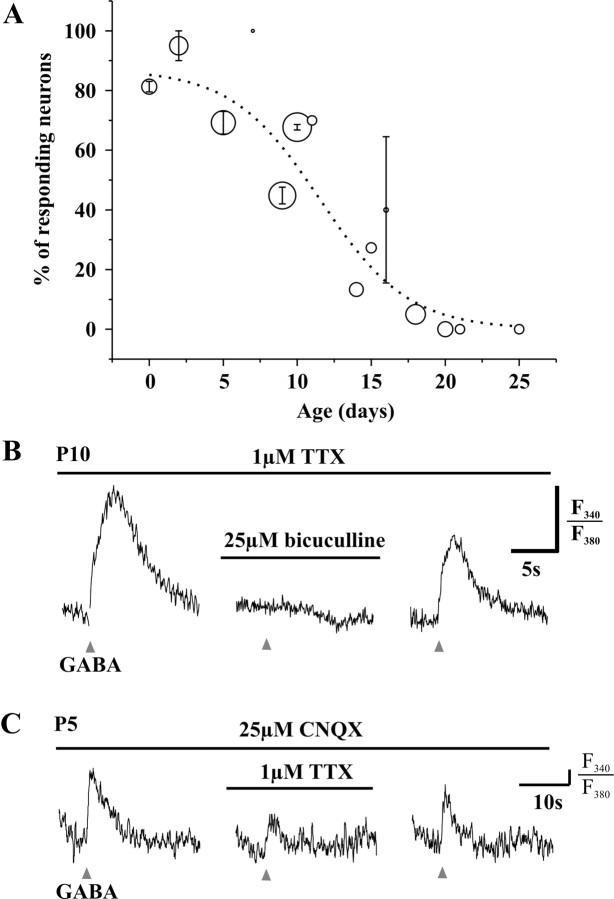
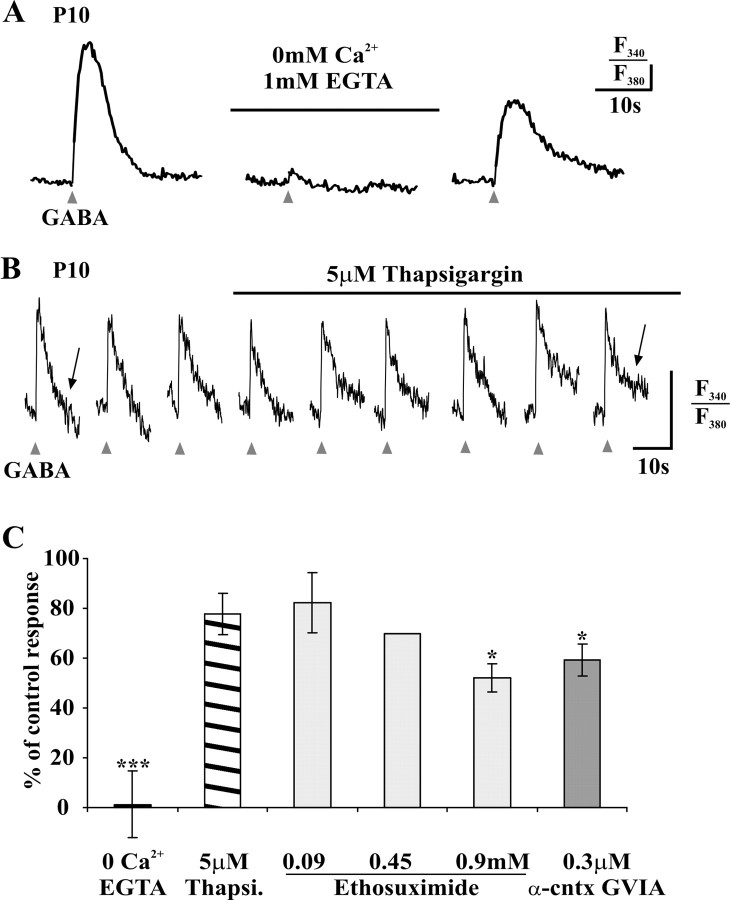
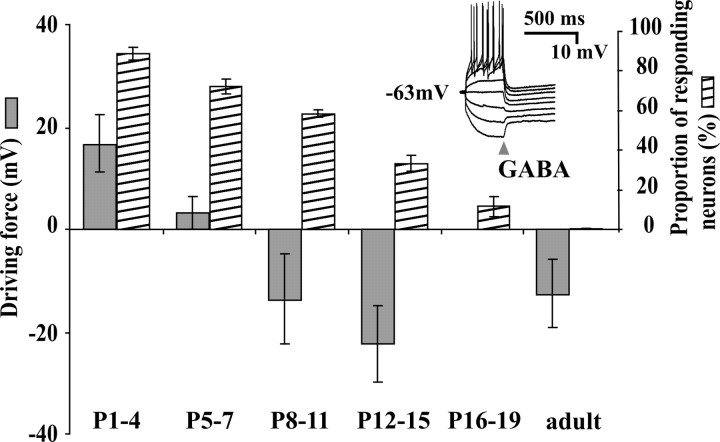
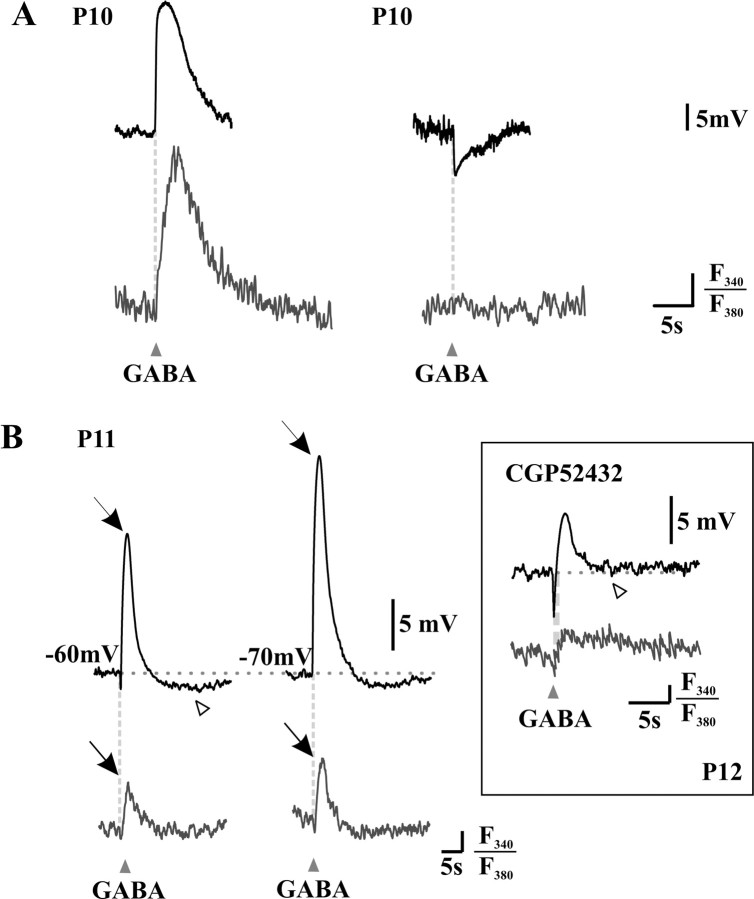
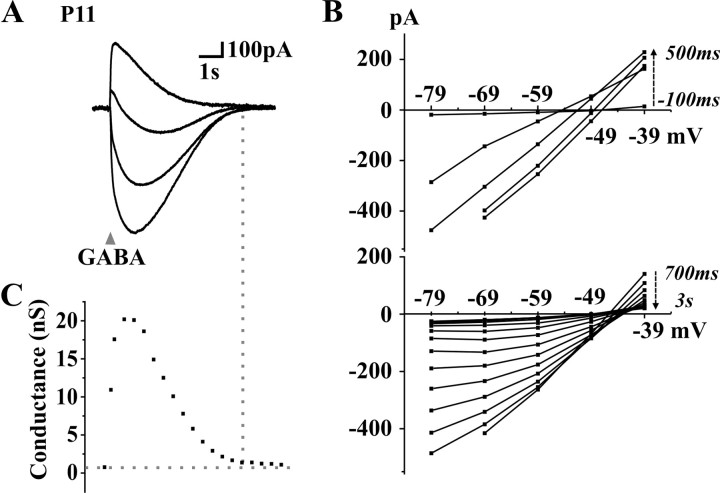
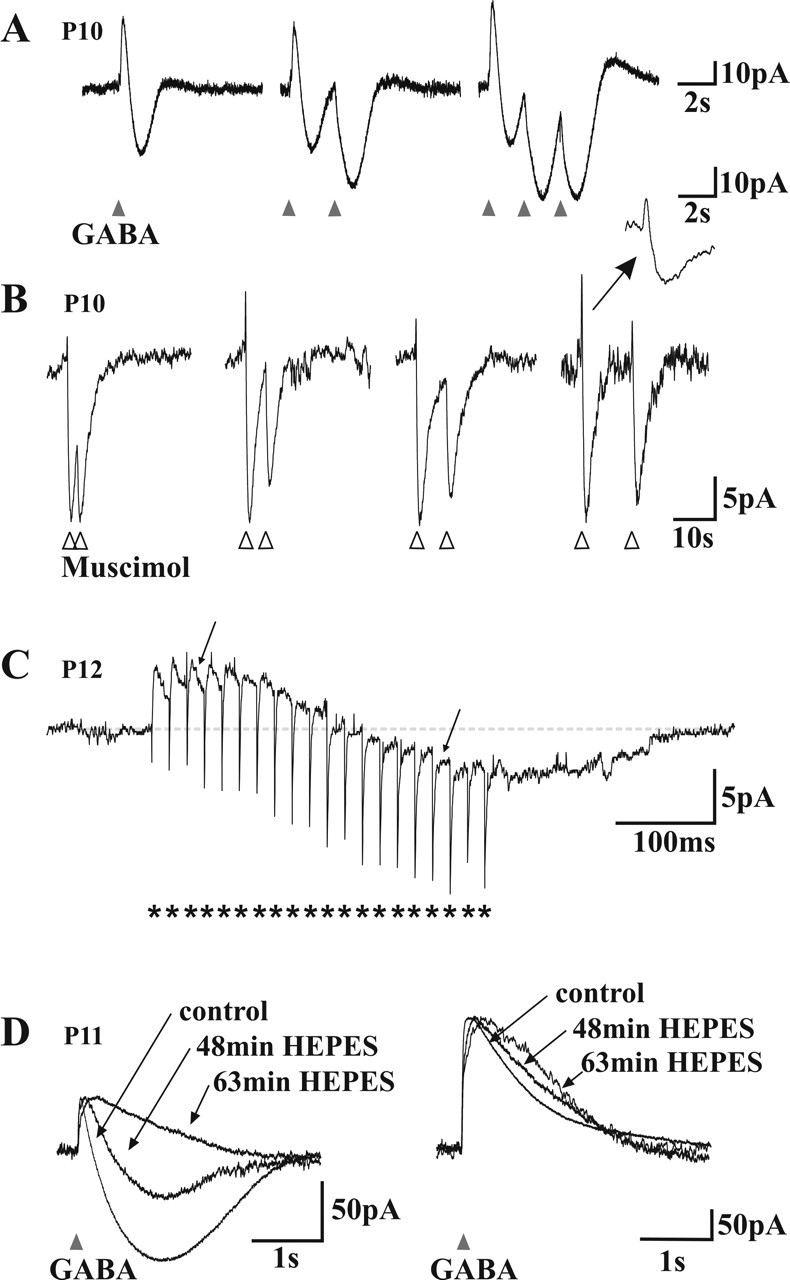
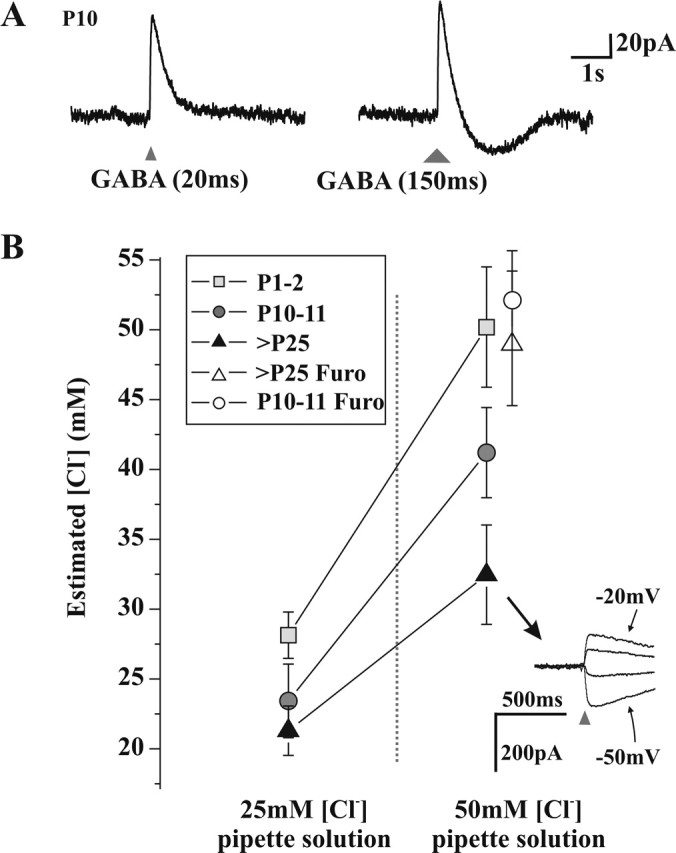
A deficit in inhibition in the spinal dorsal horn has been proposed to be an underlying cause of the exaggerated cutaneous sensory reflexes observed in newborn rats. However, the developmental shift in transmembrane anion gradient, potentially affecting the outcome of GABAA transmission, was shown to be completed within 1 week after birth in the spinal cord, an apparent disparity with the observation that reflex hypersensitivity persists throughout the first 2-3 postnatal weeks. To further investigate this issue, we used several approaches to assess the action of GABA throughout development in spinal lamina I (LI) neurons. GABA induced an entry of extracellular calcium in LI neurons from postnatal day 0 (P0) to P21 rats, which involved T- and N-type voltage-gated calcium channels. Gramicidin perforated-patch recordings revealed that the shift in anion gradient was completed by P7 in LI neurons. However, high chloride pipette recordings demonstrated that these neurons had not reached their adult chloride extrusion capacity by P10-P11. Simultaneous patch-clamp recordings and calcium imaging revealed that biphasic responses to GABA, consisting of a primary hyperpolarization followed by a rebound depolarization, produced a rise in [Ca2+]i. Thus, even if Eanion predicts GABAA-induced hyperpolarization from rest, a low chloride extrusion capacity can cause a rebound depolarization and an ensuing rise in [Ca2+]i. We demonstrate that GABA action in LI neurons matures throughout the first 3 postnatal weeks, therefore matching the time course of maturation of withdrawal reflexes. Immature spinal GABA signaling may thus contribute to the nociceptive hypersensitivity in infant rats.


Figures

Figure 1.
Figure 1.
Short (20-30 ms) local applications of GABA (1 mm) produce a rise in [Ca2+]i in developing lamina I neurons. A, Evolution of this effect (in 1 μm TTX). Circles are centered at the mean percentage of responding neurons, and their diameter is proportional to the number of neurons tested with GABA at each age (n = 3-31); the error bars represent the SEM for mean percentages obtained from different days of experiment on animals of the same age (n = 1-4). B, The rise in [Ca2+]i induced (in 1 μm TTX) by GABA applications (triangles) is inhibited by 25 μm bicuculline (horizontal bar). C, GABA also induces a rise in [Ca2+]i in 10 μm CNQX. At P5, this effect is partially inhibited by 1 μm TTX. The [Ca2+]i response is expressed as the ratio of emission from 340 and 380 nm excitation wavelength (F340/F380); the vertical bar represents 5% of the baseline ratio.
Figure 2.
Figure 2.
The GABA-induced rise in [Ca2+]i (in 1 μm TTX) involves the entry of extracellular Ca2+ through VGCCs. A, The calcium response to brief (20-30 ms) GABA application (triangles) is inhibited in a nominally Ca2+-free ACSF (0 Ca2+ plus 1 mm EGTA; horizontal bar). The vertical bar represents 5% of the baseline F340/F380 ratio. B, Bath application of the Ca2+-ATPase blocker thapsigargin (5 μm; horizontal bar) does not affect the amplitude of GABA-induced rise in [Ca2+]i (5 min apart); note, however, the prolonged decay phase of the response during the treatment (arrows; see Results). The vertical bar represents 5% of the baselineF340/F380 ratio. C, Mean effect of the abovementioned treatments and of antagonists of VGCC, on the control response to GABA in normal ACSF. The error bars represent the SEM of measurements on different neurons. *p < 0.05 and ***p < 0.001 versus the control response (paired t test). Thapsi, Thapsigargin; α-cntx GVIA, α-conotoxin GVIA.
Figure 3.
Figure 3.
Time course of the evolution of the driving force of anions and the percentage of neurons responding to brief GABA applications (20-30 ms, in 1 μm TTX) with a rise in [Ca2+]i. The driving force for individual neurons is calculated from the measure of the resting potential and the reversal potential for anions in perforated patch using gramicidin. Inset, Example of recordings used to measure Eanion (in current-clamp mode in this case). Each trace shows a voltage response to 10 pA incremental current step; peak response was measured at 200 ms from GABA puff (arrowhead).
Figure 4.
Figure 4.
Rise in [Ca2+]i is associated with the depolarizing phases of membrane responses to brief GABA applications (20-30 ms). Simultaneous patch-clamp recordings (current-clamp mode; top lines) and calcium imaging (bottom lines) were used to analyze the responses to GABAA agonist applications (arrowheads). A, Recordings from two neurons illustrating that depolarizing responses to GABA are accompanied by a rise in [Ca2+]i (left), whereas hyperpolarizing responses are not (right). B, Recordings from a third neuron illustrating that biphasic responses to GABA are also accompanied by a small calcium response (left), whose amplitude increases (arrows) as the neuron is hyperpolarized (from -60 to -70 mV using current injections) to present a smaller, pure depolarizing response (right). Note, however, a third hyperpolarizing phase at the end of the response (open arrowhead). Inset, When GABA was applied in the presence of the GABAB receptor antagonist CGP 52432, this third phase was absent (open arrowhead, compare with traces on the left), yet the biphasic response was still accompanied by a rise in [Ca2+]i. The vertical bar represents 1% of the baseline F340/F380 ratio.
Figure 5.
Figure 5.
Current-voltage analysis of the responses to GABA in a neuron presenting a biphasic response at rest. A, Voltage-clamp traces of the responses to brief (20 ms) GABA applications at different holding potentials (-20 to +30 mV from rest; Vrest of -49 mV). B, I-V curves at different time points (200 ms apart) during the first 500 ms (top) and after 3 s (bottom) of the current response to GABA. C, Evolution of the cell conductance during the response, as calculated from the slope of I-V traces at different time points.
Figure 6.
Figure 6.
Mechanism of GABAA receptor-mediated biphasic responses. A, Voltage-clamp recordings of the response of a neuron to different patterns of brief (20 ms) GABA applications The cell displayed a biphasic (outward/inward) response to GABA (left). Note that the second (middle) and third (right) application of GABA with 2 s intervals produce a monophasic inward current. Note also the small outward tail response after repetitive applications. B, Voltage-clamp recordings of the response of a neuron to pairs of brief (20 ms) muscimol applications (5, 10, 15, or 25 s interval; in the presence of CGP 54523). The second response was also monophasic when superimposed on the inward phase of the first response. Note that repetitive applications of muscimol do not induce the small outward tail. Inset, An enlargement on a faster timescale (same as in A). Traces are normalized to the amplitude of the first response to help comparisons. C, Voltage-clamp trace of a neuron responding to a train of focal electrical stimulations (short burst of 20 pulses, indicated by asterisks, at 25 ms intervals). Note the slowly developing inward phase and how individual synaptic currents have their polarity inverted (arrows) during this late inward phase. D, Effect of the replacement of the bicarbonate buffer by a HEPES buffer in the ACSF. Left, The inward phase of the biphasic responses observed near resting potential faded with time in HEPES. Right, At depolarized holding potentials (-39 mV), in which outward only responses were recorded, the decay phase of the responses was prolonged in HEPES. Traces are normalized to the amplitude of the first response to allow for comparison of the kinetics.
Figure 7.
Figure 7.
Measurement of Cl- extrusion capacity at different developmental stages. A, Voltage-clamp recordings of a neuron presenting a monophasic outward current in response to a 20 ms application of GABA (triangle, left), whereas a 150 ms application (larger triangle, right) produces a biphasic current response. B, Estimated [Cl-]i based on Eanion measurements (see Materials and Methods) in whole-cell recorded neurons, with two high [Cl-] pipette solutions, at three developmental stages. There is a significant effect of age (p < 0.001) and pipette [Cl-] (p < 0.001) on the resulting [Cl-]i (two-way ANOVA). In the presence of the KCC2 antagonist furosemide (Furo), the estimated [Cl-]i of P10-P11 and adult neurons was not different from that of the pipette solution (50 mm). Inset, Example of responses to 20 ms applications of GABA (triangles) obtained at different holding potentials (10 mV apart) of an adult neuron with 50 mm [Cl-] in the pipette.

Similar articles

Cited by

References

    1. Abe Y, Furukawa K, Itoyama Y, Akaike N (1994) Glycine response in acutely dissociated ventromedial hypothalamic neuron of the rat: new approach with gramicidin perforated patch-clamp technique. J Neurophysiol 72: 1530-1537. - PubMed
    1. Baccei ML, Fitzgerald M (2004) Development of GABAergic and glycinergic transmission in the neonatal rat dorsal horn. J Neurosci 24: 4749-4757. - PMC - PubMed
    1. Balakrishnan V, Becker M, Lohrke S, Nothwang HG, Guresir E, Friauf E (2003) Expression and function of chloride transporters during development of inhibitory neurotransmission in the auditory brainstem. J Neurosci 23: 4134-4145. - PMC - PubMed
    1. Bao J, Li JJ, Perl ER (1998) Differences in Ca2+ channels governing generation of miniature and evoked excitatory synaptic currents in spinal laminae I and II. J Neurosci 18: 8740-8750. - PMC - PubMed
    1. Ben Ari Y (2002) Excitatory actions of GABA during development: the nature of the nurture. Nat Rev Neurosci 3: 728-739. - PubMed

Publication types

MeSH terms

LinkOut - more resources