Comparative Study
. 2005 Oct 19;25(42):9694-703.
doi: 10.1523/JNEUROSCI.2980-05.2005.

Fyn kinase induces synaptic and cognitive impairments in a transgenic mouse model of Alzheimer's disease

Affiliations
Comparative Study

Fyn kinase induces synaptic and cognitive impairments in a transgenic mouse model of Alzheimer's disease

Jeannie Chin et al. J Neurosci. .

Abstract

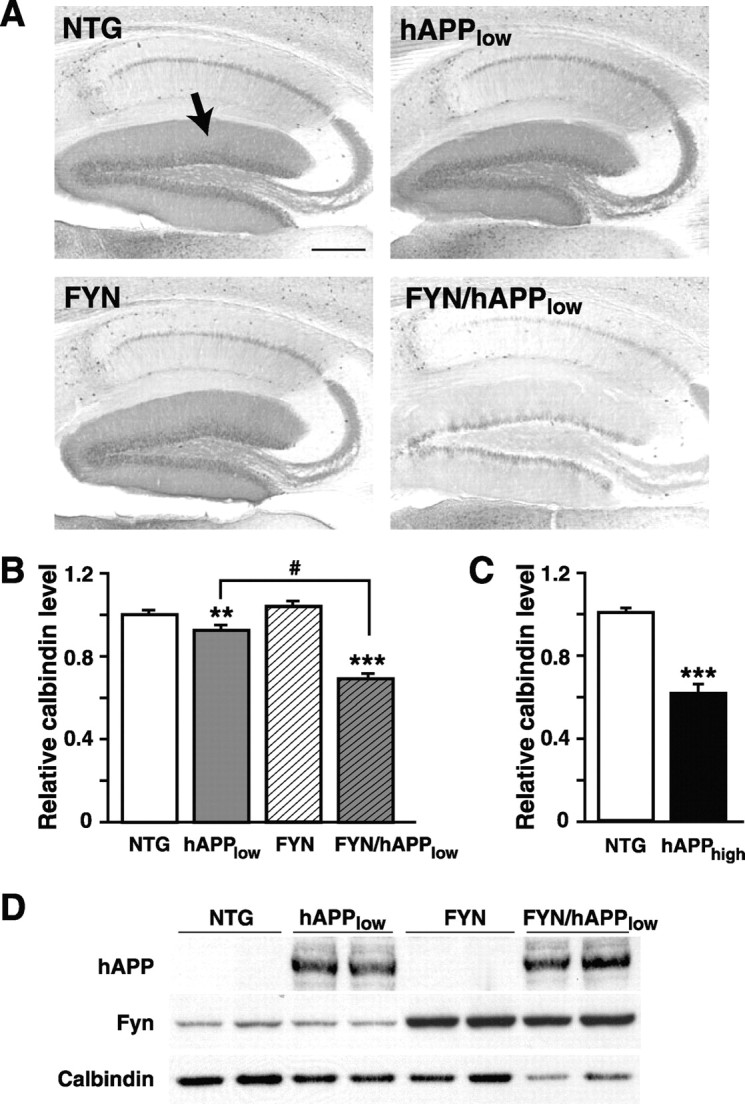
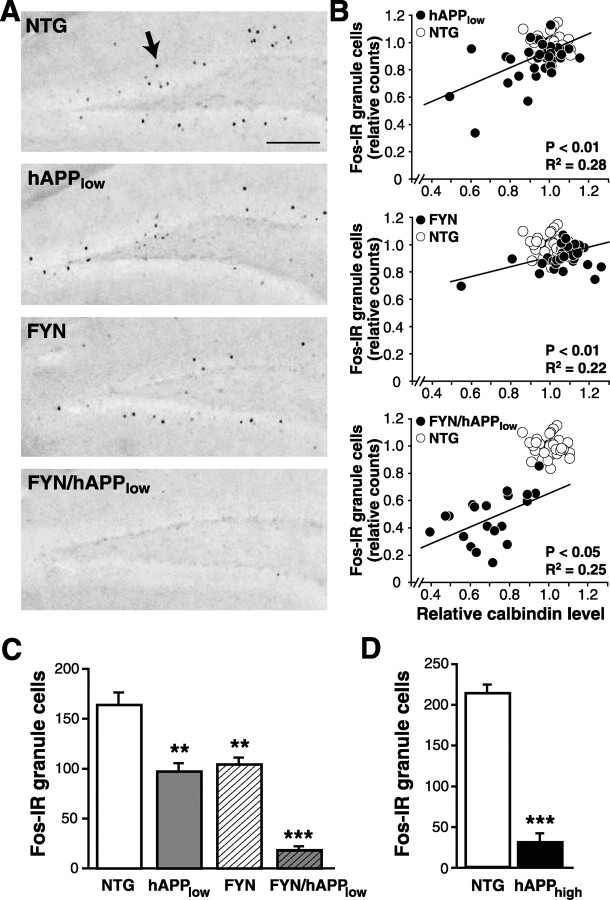
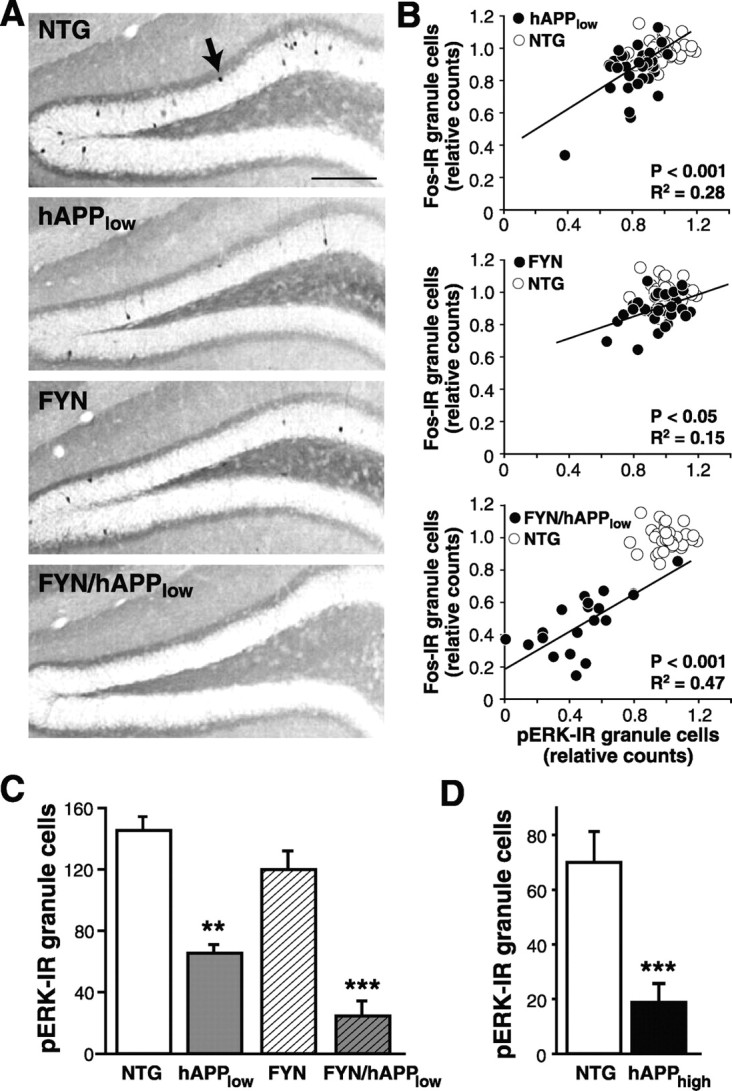
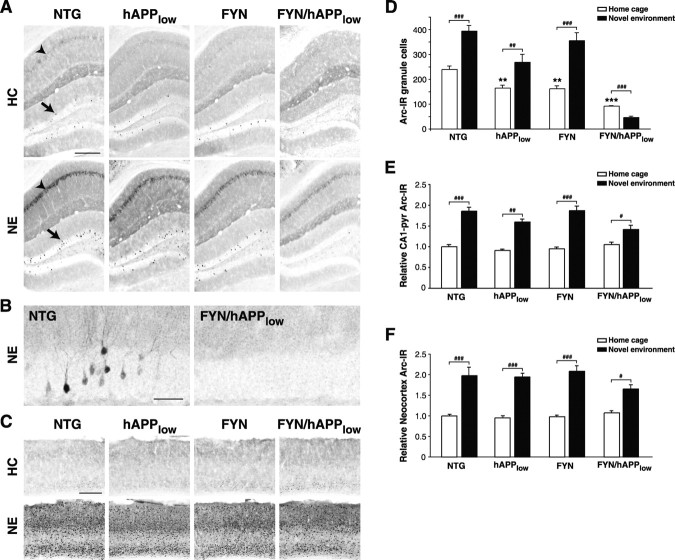
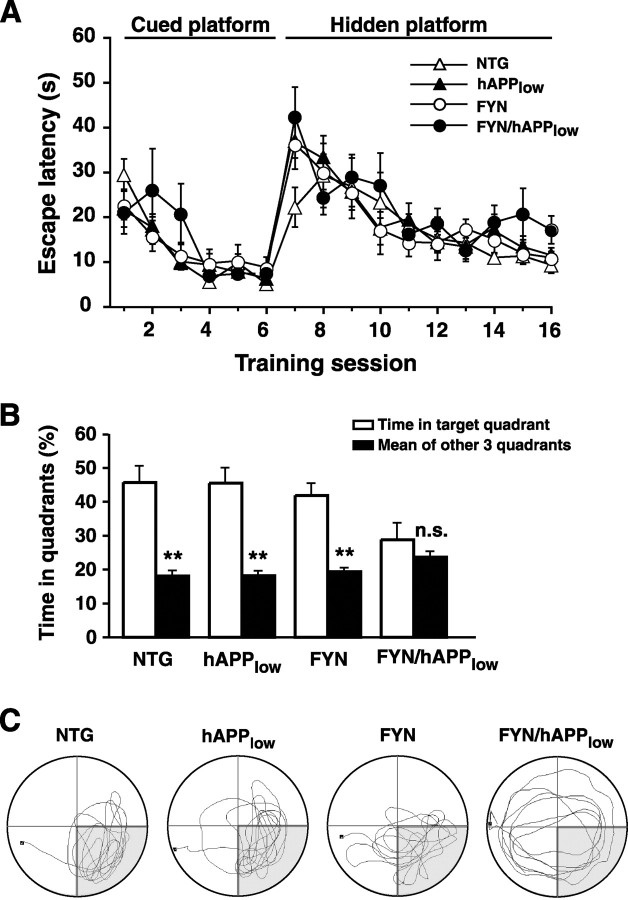
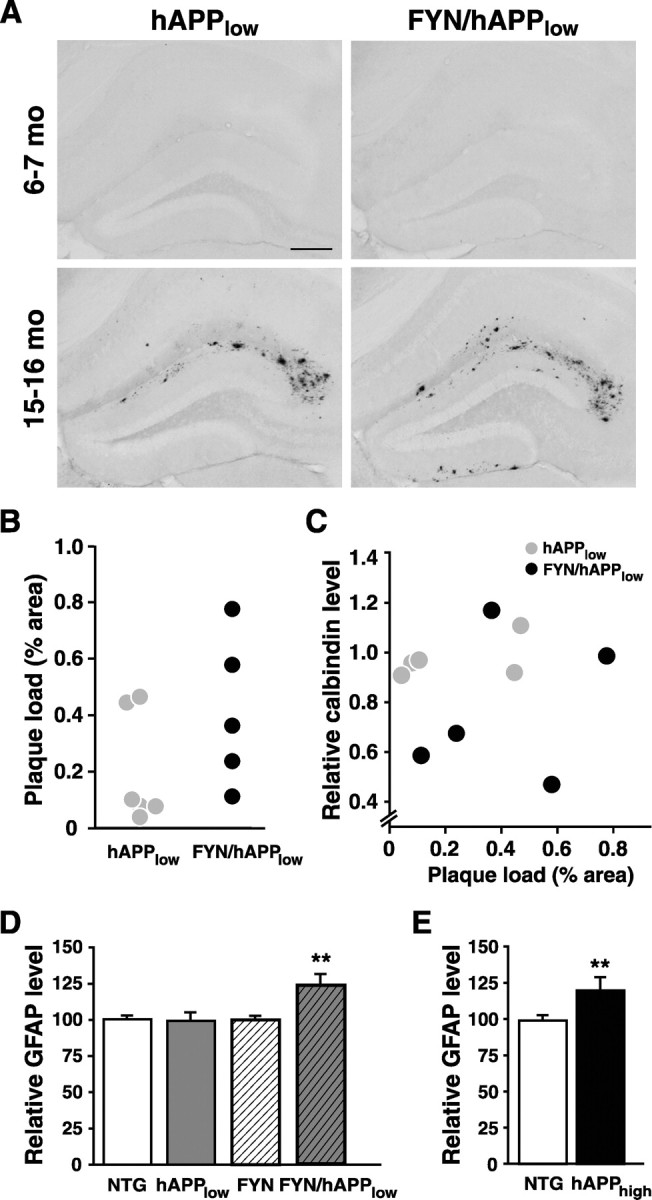
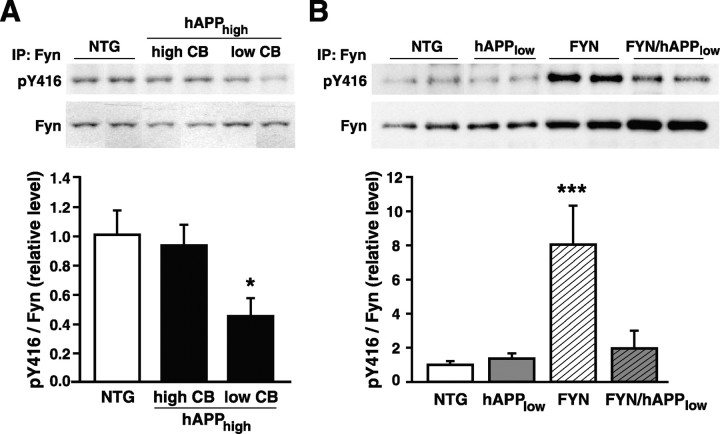
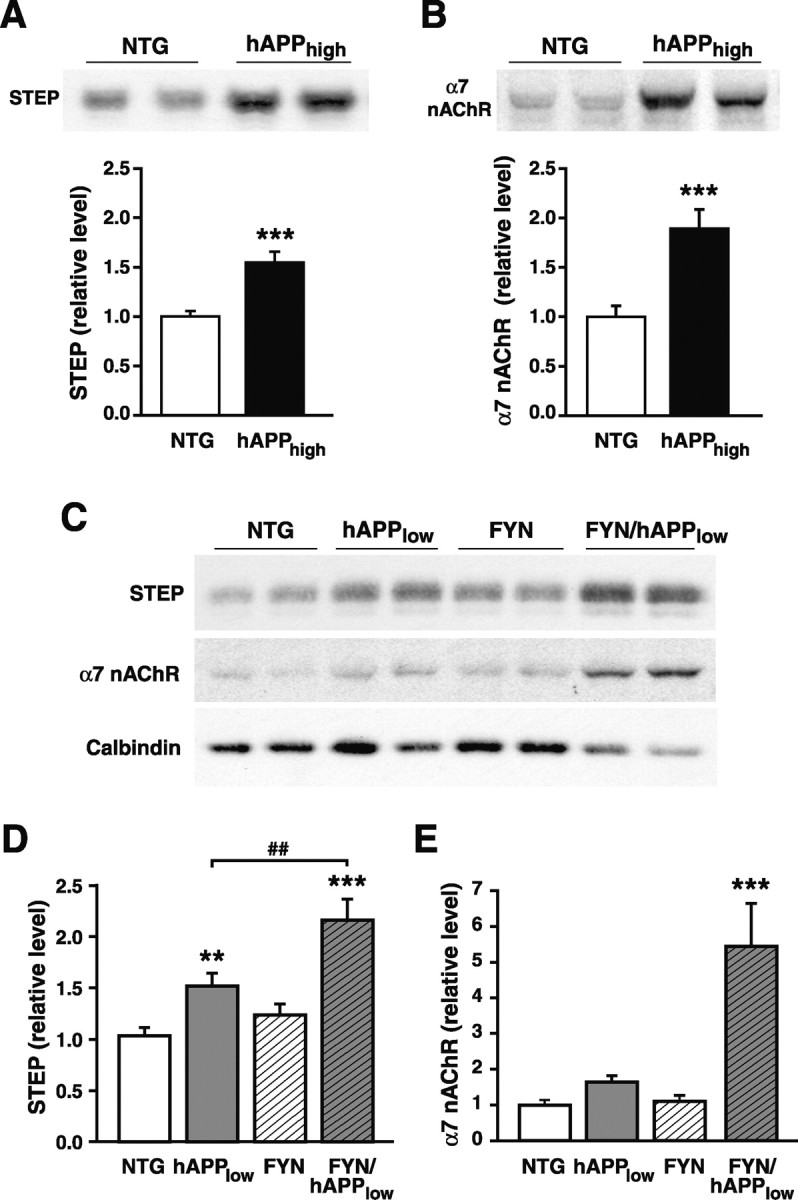
Human amyloid precursor protein (hAPP) transgenic mice with high levels of amyloid-beta (Abeta) develop behavioral deficits that correlate with the depletion of synaptic activity-related proteins in the dentate gyrus. The tyrosine kinase Fyn is altered in Alzheimer's disease brains and modulates premature mortality and synaptotoxicity in hAPP mice. To determine whether Fyn also modulates Abeta-induced behavioral deficits and depletions of synaptic activity-dependent proteins, we overexpressed Fyn in neurons of hAPP mice with moderate levels of Abeta production. Compared with nontransgenic controls and singly transgenic mice expressing hAPP or FYN alone, doubly transgenic FYN/hAPP mice had striking depletions of calbindin, Fos, and phosphorylated ERK (extracellular signal-regulated kinase), impaired neuronal induction of Arc, and impaired spatial memory retention. These deficits were qualitatively and quantitatively similar to those otherwise seen only in hAPP mice with higher Abeta levels. Surprisingly, levels of active Fyn were lower in high expresser hAPP mice than in NTG controls and lower in FYN/hAPP mice than in FYN mice. Suppression of Fyn activity may result from dephosphorylation by striatal-enriched phosphatase, which was upregulated in FYN/hAPP mice and in hAPP mice with high levels of Abeta. Thus, increased Fyn expression is sufficient to trigger prominent neuronal deficits in the context of even relatively moderate Abeta levels, and inhibition of Fyn activity may help counteract Abeta-induced impairments.


Figures

Figure 1.
Figure 1.
Increased expression of Fyn triggers hAPP/Aβ-induced depletion of calbindin in the dentate gyrus. A, Immunostaining for calbindin in the molecular layer of the dentate gyrus (arrow) demonstrates marked depletion in a severely affected FYN/hAPPlow mouse compared with NTG and singly TG mice. B, C, Quantitation of relative calbindin immunoreactivity (IR) levels in the molecular layer of the dentate gyrus in 23-37 mice per genotype (B) and 9 mice per genotype (C). The interaction between hAPPlow and FYN was significant by ANOVA (p < 0.001). **p < 0.01, ***p < 0.001 versus NTG; #p < 0.05. D, Western blot analysis of dentate gyrus lysates demonstrates comparable levels of hAPP (top) and Fyn (middle) overexpression in singly TG and FYN/hAPPlow mice, as well as calbindin reductions in FYN/hAPPlow mice (bottom). Scale bar, 250 μm.
Figure 2.
Figure 2.
hAPP/Aβ and Fyn cooperate to diminish the number of Fos-positive granule cells in FYN/hAPPlow mice. A, Immunostaining for Fos demonstrates a typical pattern of granule cell labeling (arrow) in the dentate gyrus of an NTG mouse and different degrees of Fos reduction in TG mice. FYN/hAPPlow mice were affected most severely. B, Calbindin levels correlated with the number of Fos-positive granule cells in singly and doubly TG mice but not in NTG controls. The p and R2 values refer to TG groups only. C, D, Quantitation of Fos-positive granule cells revealed significant reductions in hAPPlow and FYN mice (C). FYN/hAPPlow mice had more severe depletions (C) that were of similar magnitude as those in hAPPhigh mice (D). n = 23-37 (C) or n = 9 (D) mice per genotype. **p < 0.01, ***p < 0.001 versus NTG. Scale bar, 100 μm.
Figure 3.
Figure 3.
hAPP/Aβ and Fyn cooperate to diminish the number of pERK1/2-positive granule cells in FYN/hAPPlow mice. A, Immunostaining for phosphorylated ERK1/2 (pERK1/2) demonstrates a typical pattern of granule cell labeling (arrow) in the dentate gyrus of an NTG mouse and different degrees of pERK1/2 reduction in TG mice. FYN/hAPPlow mice were affected most severely. B, Significant correlations between the numbers of pERK1/2- and Fos-positive granule cells were identified in singly and doubly TG mice but not in NTG controls. The p and R2 values refer to TG groups only. C, D, Quantitation of pERK1/2-positive granule cells revealed a significant reduction in hAPPlow mice (C). FYN/hAPPlow mice had more severe depletions (C) that were of similar magnitude as those in hAPPhigh mice (D). n = 23-37 (C) or n = 9 (D) mice per genotype. **p < 0.01, ***p < 0.001 versus NTG. Scale bar, 100 μm.
Figure 4.
Figure 4.
Impaired induction of Arc expression in FYN/hAPPlow mice. A, Micrographs demonstrating Arc-IR granule cells in the dentate gyrus (arrow) and pyramidal cells in CA1 (arrowhead) in home-caged mice (HC; top) and mice that had explored a novel environment (NE; bottom). B, High-magnification micrographs illustrating that granule cells in the dentate gyrus were Arc immunoreactive in an NTG mouse (left), but not in a FYN/hAPPlow mouse (right), after exploration of a novel environment. C, Micrographs demonstrating Arc-IR cells in the neocortex of mice that had (bottom) or had not (top) explored the novel environment. D-F, Quantitation of Arc immunolabeling (n = 3-10 mice per genotype and condition) demonstrates that environmental exploration increased the number of Arc-positive granule cells in NTG and singly TG mice but not in FYN/hAPPlow mice (D). In contrast, environmental exploration increased Arc induction in the pyramidal (Pyr) cell layer of the CA1 region (E) and the neocortex (F) also in FYN/hAPPlow mice, although to a somewhat lesser extent than in NTG and FYN mice. For CA1 and neocortex data, measurements in each bar were normalized against the mean of the home-caged NTG mice. **p < 0.01, ***p < 0.001 versus NTG by ANOVA; ##p < 0.01, ###p < 0.001 by Fisher's PLSD post hoc test. Scale bars: A, C, 250 μm; B, 50 μm.
Figure 5.
Figure 5.
Impaired spatial memory retention in FYN/hAPPlow mice. A, Acquisition of the cued and hidden platform portions of the Morris water maze test was similar in all groups of mice (n = 7-11 per genotype). B, During the probe trial (platform removed), FYN/hAPPlow mice showed no preference for the target quadrant, whereas NTG, hAPPlow, and FYN mice spent significantly more time searching the target quadrant than the other three quadrants. **p < 0.01 versus target quadrant by Student's t test. C, Representative examples of swim paths during the probe trial. Shading indicates the target quadrant.
Figure 6.
Figure 6.
Behavioral alterations of FYN/hAPPlow mice in the elevated plus maze. A, B, FYN/hAPPlow mice spent significantly more time in the open arms (A) and peered more often over the edges of the maze (B) than the other three groups (n = 15-25 mice per genotype). C, FYN/hAPPlow mice showed no preference for the closed arms, whereas NTG, hAPPlow, and FYN mice spent significantly more time in the closed arms than in the open arms of the maze. D-F, Compared with NTG controls, singly TG hAPPhigh mice also spent more time in the open arms (D), peered over the edges of the apparatus more often (E), and showed no significant preference for the closed arms (F) (n = 12-13 mice per genotype). **p < 0.01 versus NTG by Student's t test (D, E); ***p < 0.001 versus NTG by ANOVA (A, B) or versus closed arms by Student's t test (C, F).
Figure 7.
Figure 7.
Overexpression of Fyn does not affect amyloid deposition but elicits an astroglial injury response in FYN/hAPPlow mice. A, At 6-7 months (mo) of age (top), immunostaining for Aβ revealed no amyloid deposits in hAPPlow and FYN/hAPPlow mice. At 15-16 months (bottom), these mice had comparable levels of amyloid deposition. B, Quantitation of amyloid deposition in 15- to 16-month-old mice. C, Plaque load did not correlate with calbindin levels in 15- to 16-month-old hAPPlow or FYN/hAPPlow mice. D, Quantitation of GFAP immunoreactivity in 6- to 7-month-old mice revealed increased astroglial GFAP expression indicative of reactive astrocytosis in FYN/hAPPlow mice relative to NTG or singly TG mice (n = 8-12 per genotype). E, Age-matched hAPPhigh mice had similar increases in GFAP expression (n = 10 per genotype). **p < 0.01 versus NTG by ANOVA (D) or Student's t test (E). Scale bar, 250 μm.
Figure 8.
Figure 8.
Decreased levels of active Fyn in the dentate gyrus of hAPPhigh and FYN/hAPPlow mice. Total Fyn was immunoprecipitated from isolated dentate gyri of 2- to 3-month-old mice and analyzed by Western blot using antibodies that recognize active Fyn (pY416) or both active and inactive Fyn. A, Levels of active Fyn were decreased in hAPPhigh mice with depletions of calbindin in the dentate gyrus but not in hAPPhigh mice with relatively normal levels of calbindin (n = 4-9 per group). B, Singly TG FYN mice exhibited expected increases in active Fyn, but this increase was attenuated in FYN/hAPPlow mice (n = 3-5 per genotype). *p < 0.05, ***p < 0.001 versus NTG by ANOVA.
Figure 9.
Figure 9.
STEP and α7 nAChRs are elevated in the dentate gyrus of hAPPhigh and FYN/hAPPlow mice. A, Levels of the 61 kDa form of STEP in the dentate gyrus were higher in hAPPhigh mice than in NTG controls (n = 11-12 per genotype). B, Levels of α7 nAChRs in the dentate gyrus were also significantly elevated in hAPPhigh mice (n = 7 per genotype). C, Representative Western blots illustrating STEP, α7 nAChR, and calbindin levels in the dentate gyrus of NTG, hAPPlow, FYN, and FYN/hAPPlow mice. D, E, Quantitation of STEP (D) and α7 nAChR (E) levels demonstrates twofold to fivefold increases in these proteins in FYN/hAPPlow mice relative to NTG controls (n = 8-12 per genotype). ***p < 0.001 versus NTG by Student's t test (A, B); **p < 0.01, ***p < 0.001 versus NTG by ANOVA; ## p < 0.01 by PLSD post hoc test (D).

Similar articles

Cited by

References

    1. Arancio O, Zhang HP, Chen X, Lin C, Trinchese F, Puzzo D, Liu S, Hegde A, Yan SF, Stern A, Luddy JS, Lue LF, Walker DG, Roher A, Buttini M, Mucke L, Li W, Schmidt AM, Kindy M, Hyslop PA, et al. (2004) RAGE potentiates Aβ-induced perturbation of neuronal function in transgenic mice. EMBO J 23: 4096-4105. - PMC - PubMed
    1. Atkins CM, Selcher JC, Petraitis JJ, Trzaskos JM, Sweatt JD (1998) The MAPK cascade is required for mammalian associative learning. Nat Neurosci 1: 602-609. - PubMed
    1. Bi X, Gall CM, Zhou J, Lynch G (2002) Uptake and pathogenic effects of amyloid beta peptide 1-42 are enhanced by integrin antagonists and blocked by NMDA receptor antagonists. Neuroscience 112: 827-840. - PubMed
    1. Blum S, Moore AN, Adams F, Dash PK (1999) A mitogen-activated protein kinase cascade in the CA1/CA2 subfield of the dorsal hippocampus is essential for long-term spatial memory. J Neurosci 19: 3535-3544. - PMC - PubMed
    1. Chawla MK, Guzowski JF, Ramirez-Amaya V, Lipa P, Hoffman KL, Marriott LK, Worley PF, McNaughton BL, Barnes CA (2005) Sparse, environmentally selective expression of Arc RNA in the upper blade of the rodent fascia dentata by brief spatial experience. Hippocampus 15: 579-586. - PubMed

Publication types

MeSH terms

Substances