The role of sensory network dynamics in generating a motor program
- PMID: 16237184
- PMCID: PMC6725745
- DOI: 10.1523/JNEUROSCI.2249-05.2005
The role of sensory network dynamics in generating a motor program
Abstract
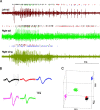
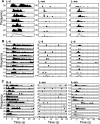
Sensory input plays a major role in controlling motor responses during most behavioral tasks. The vestibular organs in the marine mollusk Clione, the statocysts, react to the external environment and continuously adjust the tail and wing motor neurons to keep the animal oriented vertically. However, we suggested previously that during hunting behavior, the intrinsic dynamics of the statocyst network produce a spatiotemporal pattern that may control the motor system independently of environmental cues. Once the response is triggered externally, the collective activation of the statocyst neurons produces a complex sequential signal. In the behavioral context of hunting, such network dynamics may be the main determinant of an intricate spatial behavior. Here, we show that (1) during fictive hunting, the population activity of the statocyst receptors is correlated positively with wing and tail motor output suggesting causality, (2) that fictive hunting can be evoked by electrical stimulation of the statocyst network, and (3) that removal of even a few individual statocyst receptors critically changes the fictive hunting motor pattern. These results indicate that the intrinsic dynamics of a sensory network, even without its normal cues, can organize a motor program vital for the survival of the animal.
Figures


Similar articles
-
Dual sensory-motor function for a molluskan statocyst network.J Neurophysiol. 2004 Jan;91(1):336-45. doi: 10.1152/jn.00753.2003. Epub 2003 Sep 24. J Neurophysiol. 2004. PMID: 14507988
-
Pharmacologically induced elements of the hunting and feeding behavior in the pteropod mollusk Clione limacina. II. Effects of physostigmine.J Neurophysiol. 1993 Feb;69(2):522-32. doi: 10.1152/jn.1993.69.2.522. J Neurophysiol. 1993. PMID: 8459283
-
Control of locomotion in marine mollusk Clione Limacina. IX. Neuronal mechanisms of spatial orientation.J Neurophysiol. 1995 May;73(5):1924-37. doi: 10.1152/jn.1995.73.5.1924. J Neurophysiol. 1995. PMID: 7623091
-
Behavioral states, network states, and sensory response variability.J Neurophysiol. 2008 Sep;100(3):1160-8. doi: 10.1152/jn.90592.2008. Epub 2008 Jul 9. J Neurophysiol. 2008. PMID: 18614753 Free PMC article. Review.
-
Correlations between the activity of sensory neurons and behavior: how much do they tell us about a neuron's causality?Curr Opin Neurobiol. 2010 Jun;20(3):376-81. doi: 10.1016/j.conb.2010.05.002. Curr Opin Neurobiol. 2010. PMID: 20545019 Free PMC article. Review.
Cited by
-
Generating spatiotemporal joint torque patterns from dynamical synchronization of distributed pattern generators.Front Neurorobot. 2009 Oct 29;3:2. doi: 10.3389/neuro.12.002.2009. eCollection 2009. Front Neurorobot. 2009. PMID: 20011216 Free PMC article.
-
Neural manifold analysis of brain circuit dynamics in health and disease.J Comput Neurosci. 2023 Feb;51(1):1-21. doi: 10.1007/s10827-022-00839-3. Epub 2022 Dec 16. J Comput Neurosci. 2023. PMID: 36522604 Free PMC article. Review.
-
Organization of Anti-Phase Synchronization Pattern in Neural Networks: What are the Key Factors?Front Syst Neurosci. 2011 Dec 7;5:100. doi: 10.3389/fnsys.2011.00100. eCollection 2011. Front Syst Neurosci. 2011. PMID: 22232576 Free PMC article.
-
Dimensionality reduction in neuroscience.Curr Biol. 2016 Jul 25;26(14):R656-60. doi: 10.1016/j.cub.2016.05.029. Curr Biol. 2016. PMID: 27458907 Free PMC article.
-
Dynamic trajectory of multiple single-unit activity during working memory task in rats.Front Comput Neurosci. 2015 Sep 24;9:117. doi: 10.3389/fncom.2015.00117. eCollection 2015. Front Comput Neurosci. 2015. PMID: 26441626 Free PMC article.
References
-
- Andersen RA, Snyder LH, Li CS, Stricanne B (1993) Coordinate transformations in the representation of spatial information. Curr Opin Neurobiol 3: 171-176. - PubMed
-
- Arshavsky Y, Beloozerova GN, Orlovsky GN, Panchin YV, Pavlova GA (1985) Control of locomotion in marine mollusc Clione limicana III. On the origin of rhythmic activity. Exp Brain Res 58: 273-284. - PubMed
-
- Arshavsky YI, Deliagina TG, Gamkrelidze GN, Orlovsky GN, Panchin YV, Popova LB (1993) Pharmacologically induced elements of the hunting and feeding behavior in the pteropod mollusk Clione limacina II. Effects of physostigmine. J Neurophysiol 69: 522-532. - PubMed
-
- Britten KH, Newsome WT, Shadlen MN, Celebrini S, Movshon JA (1996) A relationship between behavioral choice and the visual responses of neurons in macaque MT. Vis Neurosci 13: 87-100. - PubMed
Publication types
MeSH terms
Grants and funding
LinkOut - more resources
Full Text Sources
