. 2005 Dec 15;569(Pt 3):857-71.
doi: 10.1113/jphysiol.2005.098798. Epub 2005 Oct 20.

Modulation by melatonin of glutamatergic synaptic transmission in the carp retina

Affiliations

Modulation by melatonin of glutamatergic synaptic transmission in the carp retina

Hai Huang et al. J Physiol. .

Abstract

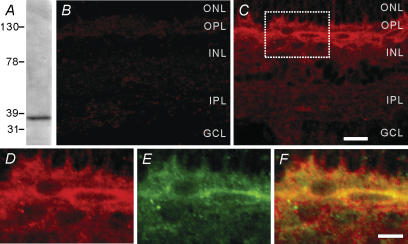
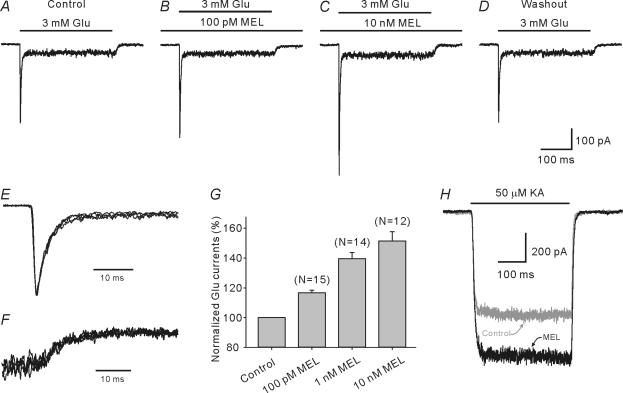
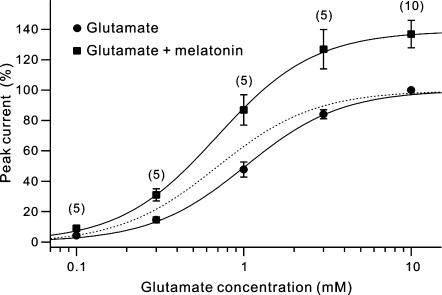
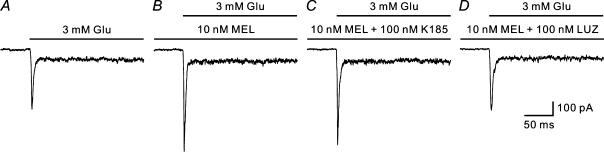
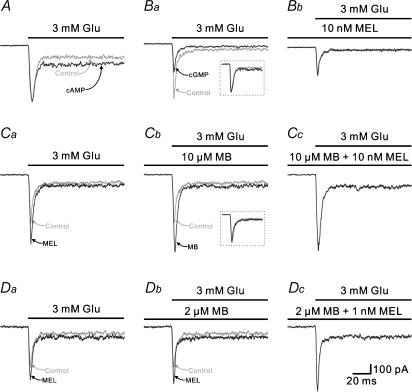
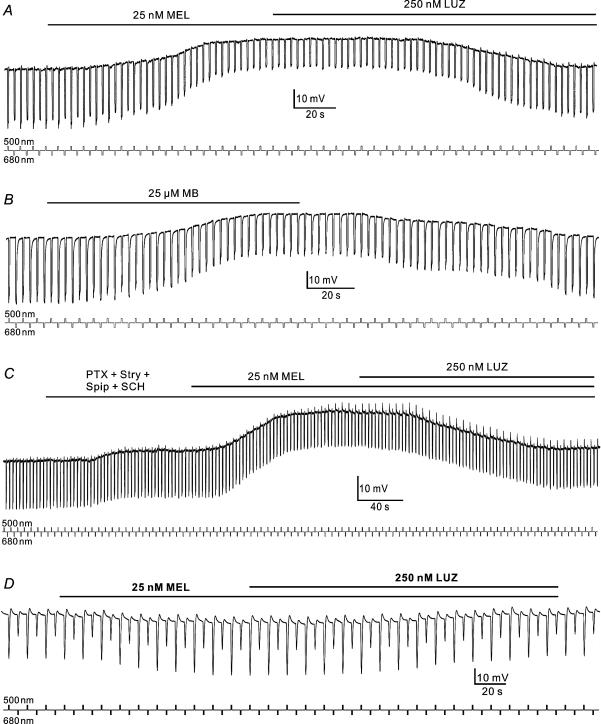
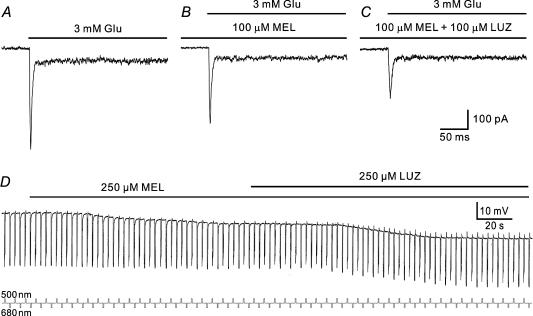
Melatonin is involved in a variety of physiological functions through activating specific receptors coupled to GTP-binding protein. Melatonin and its receptors are abundant in the retina. Here we show for the first time that melatonin modulates glutamatergic synaptic transmission from cones to horizontal cells (HCs) in carp retina. Immunocytochemical data revealed the expression of the MT1 receptor on carp HCs. Whole-cell recordings further showed that melatonin of physiological concentrations potentiated glutamate-induced currents from isolated cone-driven HCs (H1 cells) in a dose-dependent manner, by increasing the efficacy and apparent affinity of the glutamate receptor. The effects of melatonin were reversed by luzindole, but not by K 185, indicating the involvement of the MT1 receptor. Like melatonin, methylene blue (MB), a guanylate cyclase inhibitor, also potentiated the glutamate currents, but internal infusion of cGMP suppressed them. The effects of melatonin were not observed in cGMP-filled and MB-incubated HCs. These results suggest that the melatonin effects may be mediated by decreasing the intracellular concentration of cGMP. Consistent with these observations, melatonin depolarized the membrane potential of H1 cells and reduced their light responses, which could also be blocked by luzindole. These effects of melatonin persisted in the presence of the antagonists of receptors for dopamine, GABA and glycine, indicating a direct action of melatonin on H1 cells. Such modulation by melatonin of glutamatergic transmission from cones to HCs is thought to be in part responsible for circadian changes in light responsiveness of cone HCs in teleost retina.


Figures

Figure 1
Figure 1. Immunolabelling of carp horizontal cells with the anti-MT1 receptor antibody
A, Western blot of whole carp retina extract using the antibody revealed a single band of approximately 37 kDa at the corresponding molecular mass. B, confocal micrograph of a vertical cryostat section of the carp retina for which the MT1 receptor antibody was pre-absorbed with the immunizing antigen. Almost no immunofluorescence labelling was found, indicating that the protein recognized by the rabbit anti-MT1 antiserum used in this work may most likely be the MT1 receptor. C, confocal micrograph of a vertical section of the carp retina labelled with the MT1 antibody, showing that MT1 immunoreactivity was diffusely distributed in the neural retina. Note that the labelling was strong in the OPL and the distal part of the INL. The region of the OPL and outer INL marked by the box is shown at a higher magnification (D–F). D, micrograph of the marked region, showing MT1 immunoreactivity. E, micrograph of the same region labelled with the antibody against GAD67, a marker of GABAergic horizontal cells (HCs). F, merged images of D and E. Double-labelled elements appear yellowish. Somata and processes of the GAD67-positive HCs were clearly MT1 immunoreactive. Note that the labelling depicts the cell contours, suggesting the expression of the MT1 receptor on the cell membrane. All the micrographs were obtained by signal optical sectioning at intervals of 1.0 μm. ONL, outer nuclear layer; OPL, outer plexiform layer; INL, inner nuclear layer; IPL, inner plexiform layer; GCL, ganglion cell layer. Scale bar, 20 μm for B and C; 10 μm for D–F.
Figure 2
Figure 2. Potentiation by melatonin of glutamate-induced currents from H1 cells
A, control current response of an H1 cell to 3 mm glutamate (Glu) in normal Ringer solution; the response was characterized by fast desensitization. B and C, both peak and steady-state currents of the response of the cell were dose-dependently potentiated by incubation with melatonin (MEL) at 100 pm (B) and 10 nm (C). D, the response of the cell was obtained after washout with normal Ringer solution for 4 min. The cell was voltage clamped at −60 mV. E, activation and desensitization courses of the responses shown in B and C, when normalized, are superimposed on the control response at a much faster time scale. The two normalized traces coincide with the control trace, indicating that the receptor desensitization was unaffected by melatonin. F, deactivation courses of the responses shown in B and C, when normalized, are superimposed on the control response at a much faster time scale. The two normalized traces precisely coincide with the control trace, indicating that the receptor deactivation was unaffected by melatonin. G, relative potentiation of glutamate peak currents of H1 cells as a function of melatonin concentration. Data obtained from each cell at different concentrations of melatonin were normalized to the current of that cell recorded in normal Ringer solution and then averaged. Values in the parentheses above the bars indicate the number of cells tested for each dose. H, effects of melatonin on kainic acid (KA)-induced current from an H1 cell. The sustained current induced by 50 μm KA (grey trace, control) was significantly potentiated by 10 nm melatonin (dark trace, MEL).
Figure 3
Figure 3. Melatonin increases receptor efficacy and affinity for glutamate in H1 cells
Dose–response relationships for peak currents of H1 cells induced by glutamate in Ringer solution and in the presence of melatonin are represented by ▪ and •, respectively. For each cell, responses to three concentrations of glutamate were first recorded in Ringer solution and then in the presence of 10 nm melatonin. The response peaks obtained at different concentrations of glutamate were normalized to that of the response to 10 mm, a saturating concentration, of glutamate for each cell in the absence of melatonin. Curve fitting was performed for the averaged data, yielding EC50 values of 1.03 0.04 and 0.69 ± 0.02 mm in the absence and presence of 10 nm melatonin, respectively. The dashed curve is the normalized dose–response relationship in the presence of 10 nm melatonin, by that in normal Ringer solution, clearly demonstrating that the curve was shifted leftward by melatonin. Values in parentheses indicate the number of cells tested for each dose.
Figure 4
Figure 4. Melatonin-caused potentiation of glutamate currents is blocked by luzindole, but not K 185
The response to 3 mm glutamate (A) recorded from an H1 cell was potentiated by 10 nm melatonin (B). C, in the presence of 100 nm K 185, a specific MT2 receptor antagonist, 10 nm melatonin persisted to potentiate the current response. D, in the presence of 100 nm luzindole (LUZ), a MT1/MT2 receptor antagonist, the current response was no longer potentiated by melatonin. All the responses were recorded from the same H1 cell, which was voltage clamped at −60 mV.
Figure 5
Figure 5. Melatonin-caused potentiation of glutamate-induced currents may be mediated by cGMP
A, internal infusion with 1 mm cAMP did not change the glutamate-induced current recorded from an H1 cell. The grey trace (control) is the response to 3 mm glutamate recorded when sealing was just made, with a pipette containing 1 mm cAMP, whereas the dark trace was obtained in 5 min. Changes in intracellular cAMP did not affect the peak response, but potentiated the steady-state current. B, internal infusion with 1 mm cGMP reduced the glutamate-induced current from an H1 cell. The grey trace (control) in Ba is the response to 3 mm glutamate recorded when sealing was just made, with a pipette containing 1 mm cGMP, whereas the dark trace in Ba was obtained in 5 min (cGMP). In the inset, the dark trace, when normalized, is superimposed on the grey trace; the two traces coincide very well. When 10 nm melatonin was then applied to the cell, the glutamate current remained unchanged (Bb). C, effect of methylene blue (MB) on the glutamate current of an H1 cell. Ca, the response to 3 mm glutamate (grey trace, control) was potentiated by 10 nm melatonin (dark trace, MEL). Cb, like melatonin, 10 μm MB potentiated the current response to 3 mm glutamate, but did not change the desensitization course. The grey trace and dark trace are the control response and the 10 μm MB-potentiated response, respectively. When normalized, the two traces coincide (inset). Cc, the current response recorded in the presence of 10 μm MB was no longer potentiated by 10 nm melatonin. D, either 1 nm melatonin (Da) or 2 μm MB (Db) potentiated the current response to 3 mm glutamate of an H1 cell. The potentiated current response by adding a mixture of 2 μm MB and 1 nm melatonin was significantly larger in size than the potentiated response obtained when either 1 nm melatonin or 2 μm MB was applied alone to the cell (Dc), indicating that the effects of melatonin and MB were additive. Recordings shown in A, B, C and D were obtained in four different H1 cells.
Figure 6
Figure 6. Effects of melatonin on HCs intracellularly recorded in isolated carp retina
A–C, the retina was exposed to moderate light flashes of 500 nm (logI=−0.6) and 680 nm (logI=−0.6) presented alternately at intervals of 3 s. A, melatonin of 25 nm depolarized an H1 cell from a dark membrane potential of −28 to −10 mV and reduced the amplitudes of the light responses. The effects of melatonin were reversed by the addition of 250 nm luzindole. B, MB of 25 μm, like melatonin, depolarized an H1 cell and decreased the response amplitudes. The membrane potential and light responses fully recovered on washout. C, application of a mixture of 10 μm spiperone, 10 μm SCH 23390, 150 μm picrotoxin and 25 μm strychnine slightly depolarized the cell, but hardly changed the light responses. Addition of 25 nm melatonin depolarized the cell from −24 to −8 mV. In association with the membrane depolarization, the light responses to both test flashes were reduced in amplitudes. Co-application of 250 nm luzindole blocked the melatonin effects. The recordings shown in AC were obtained from three different H1 cells. D, effects of melatonin on a rod HC. Light responses of the rod HC to dim light flashes of 500 nm (logI=−4.0) and 680 nm (logI=−3.0) alternately presented at intervals of 6 s. Melatonin of 25 nm slightly hyperpolarized the cell from a dark membrane potential of −26 to −30 mV, and increased the light responses by about 20%. The effects of melatonin could be reversed by adding 250 nm luzindole. Light signals are indicated by small square waves below the traces.
Figure 7
Figure 7. Effects of higher concentrations of melatonin glutamate-induced current (AC) and light responses (D) of carp H1 cells
A, the current response of an H1 cell, voltage clamped at −60 mV, to 3 mm glutamate in normal Ringer solution. B, the peak response of the cell was reduced in amplitude by incubation with 100 μm melatonin. C, co-application of 100 μm luzindole further reduced the current amplitude. D, effects of 250 μm melatonin on an H1 cell, intracellularly recorded. Melatonin hyperpolarized the cell by 4 mV and slightly reduced the light responses to light flashes of 500 nm (logI=−0.6) and 680 nm (logI=−0.6), which were alternately presented. Co-application of 100 μm luzindole did not reverse the effect of melatonin on the membrane potential and instead further hyperpolarized the cell. Light signals are indicated by small square waves below the traces.

Similar articles

Cited by

References

    1. Alonso-Gomez AL, Valenciano AI, Alonso-Bedate M, Delgado MJ. Melatonin synthesis in the greenfrog retina in culture. I. Modulation by the light/dark cycle, forskolin and inhibitors of protein synthesis. Life Sci. 2000;66:675–685. - PubMed
    1. Besharse JC, Iuvone PM. Circadian clock in Xenopus eye controlling retinal serotonin N-acetyltransferase. Nature. 1983;305:133–135. - PubMed
    1. Browning C, Beresford I, Fraser N, Giles H. Pharmacological characterization of human recombinant melatonin MT(1) and MT(2) receptors. Br J Pharmacol. 2000;129:877–886. - PMC - PubMed
    1. Brzezinski A. Melatonin in humans. N Engl J Med. 1997;336:186–195. - PubMed
    1. Cahill GM. Circadian regulation of melatonin production in cultured zebrafish pineal and retina. Brain Res. 1996;708:177–181. - PubMed

Publication types

MeSH terms