. 2005 Dec 15;569(Pt 3):737-50.
doi: 10.1113/jphysiol.2005.097725. Epub 2005 Oct 20.

Synaptic fatigue at the naive perforant path-dentate granule cell synapse in the rat

Affiliations

Synaptic fatigue at the naive perforant path-dentate granule cell synapse in the rat

Therése Abrahamsson et al. J Physiol. .

Abstract

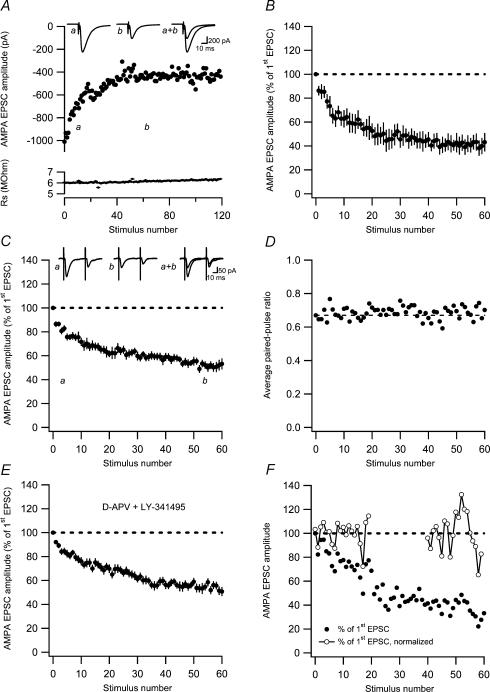
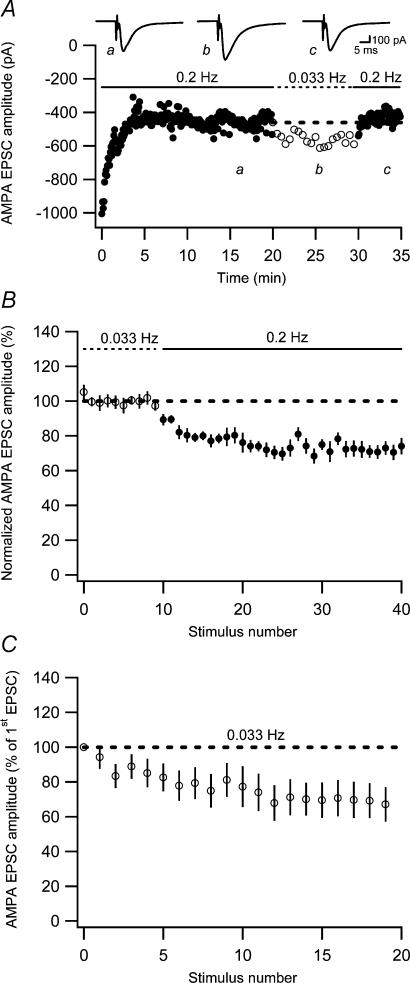
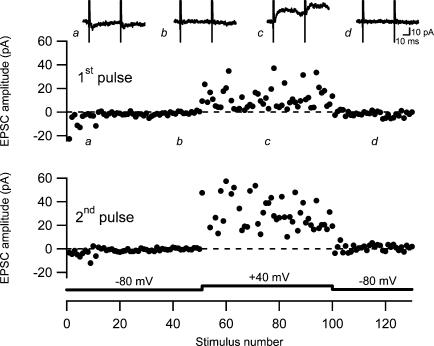
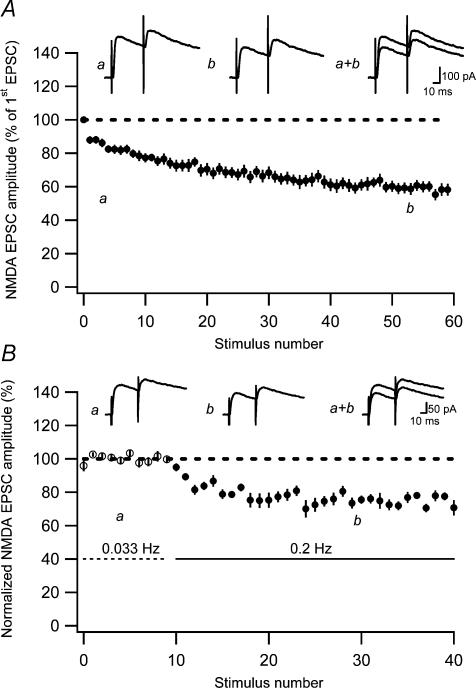
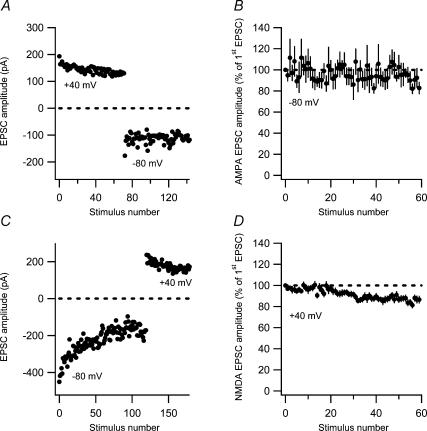
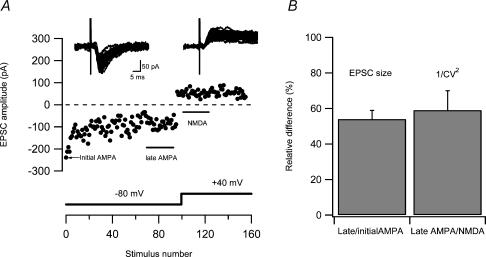
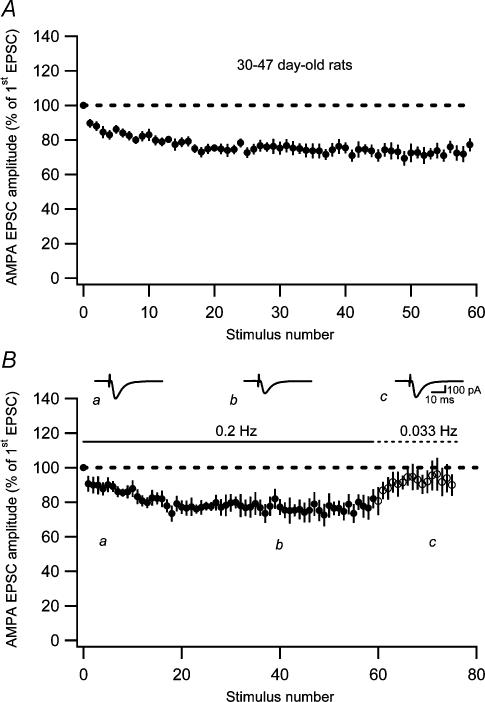
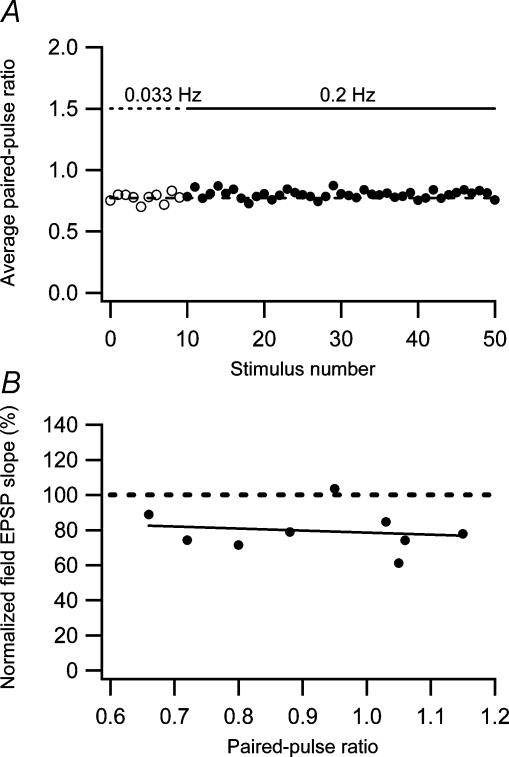
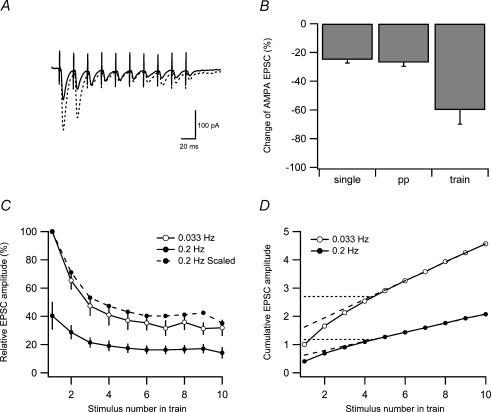
Synaptic activation at low frequency is often used to probe synaptic function and synaptic plasticity, but little is known about how such low-frequency activation itself affects synaptic transmission. In the present study, we have examined how the perforant path-dentate granule cell (PP-GC) synapse adapts to low-frequency activation from a previously non-activated (naive) state. Stimulation at 0.2 Hz in acute slices from developing rats (7-12 days old) caused a gradual depression of the AMPA EPSC (at -80 mV) to about half within 50 stimuli. This synaptic fatigue was unaffected by the NMDA and metabotropic glutamate (mGlu) receptor antagonists d-AP5 and LY-341495. A smaller component of this synaptic fatigue was readily reversible when switching to very low-frequency stimulation (0.033-0.017 Hz) and is attributed to a reversible decrease in release probability, which is probably due to depletion of readily releasable vesicles. Thus, it was expressed to the same extent by AMPA and NMDA EPSCs, and was associated with a decrease in quantal content (measured as 1/CV(2)) with no change in the paired-pulse ratio. The larger component of the synaptic fatigue was not readily reversible, was selective for AMPA EPSCs and was associated with a decrease in 1/CV(2), thus probably representing silencing of AMPA signalling in a subset of synapses. In adult rats (> 30 days old), the AMPA silencing had disappeared while the low-frequency depression remained unaltered. The present study has thus identified two forms of synaptic plasticity that contribute to fatigue of synaptic transmission at low frequencies at the developing PP-GC synapse; AMPA silencing and a low-frequency depression of release probability.


Figures

Figure 1
Figure 1. AMPA EPSC fatigue at previously unstimulated (naive) developing PP–GC synapses
A, an experiment illustrating AMPA EPSC fatigue at 0.2-Hz stimulation at −80 mV. Measurements of series resistance are plotted versus stimulus number in the lower graph. Average EPSCs (n = 10) taken at time points a and b are shown as insets. B, AMPA EPSC fatigue in response to single stimulation at 0.2 Hz (n = 7) as a function of stimulus number. Before averaging, the EPSCs in each experiment were normalized with respect to the very first evoked EPSC. C, average AMPA EPSC fatigue in response to paired-pulse stimulation (50 ms) at 0.2 Hz as a function of stimulus number (n = 10). Representative average EPSCs (n = 10) taken at time points a and b are shown as insets. D, average paired-pulse ratio during synaptic fatigue plotted as a function of stimulus number. The paired-pulse ratio measurements were constructed as ratios between average (n = 10 experiments) second and first EPSCs. Dashed line indicates the paired-pulse ratio of the first stimulus. E, AMPA EPSC fatigue in the presence of the NMDA receptor antagonist D-AP5 (50 μm) and the mGlu receptor antagonist LY-341495 (20 μm; n = 16). AMPA EPSCs were evoked by single stimulation at 0.2 Hz. F, AMPA EPSC variability during synaptic fatigue. An experiment illustrating AMPA EPSC fatigue at 0.2-Hz stimulation at −80 mV. AMPA EPSC amplitudes are normalized with respect to the very first evoked EPSC (•). EPSC amplitudes are also shown normalized with respect to the average EPSC amplitude during the first 20 sweeps and during sweep 40–60 (○–○). Note that the variability increases towards the end of the fatigue protocol.
Figure 2
Figure 2. Two components of AMPA EPSC fatigue
A, an experiment illustrating an initial AMPA EPSC fatigue, followed by a reversible increase in AMPA EPSC amplitude when switching the stimulation frequency from 0.2 to 0.033 Hz. Average EPSCs (n = 10) at the different stimulation frequencies are shown as insets. Dashed line represents average AMPA EPSC amplitude just before switching to 0.033 Hz. B, graph showing decrease of AMPA EPSC when switching from 0.033 to 0.2 Hz (n = 8). C, average AMPA EPSC fatigue in response to stimulation at 0.033 Hz as a function of stimulus number (n = 12).
Figure 3
Figure 3. Silencing of AMPA receptor-mediated signalling
An experiment illustrating sequential recordings of naive AMPA EPSCs (at −80 mV), NMDA EPSCs (at +40 mV) and AMPA EPSCs (at −80 mV). Paired-pulse stimuli (50 ms) were given at 0.2 Hz. The upper graph shows the amplitude of the first EPSC and the lower graph shows the amplitude of the second EPSC. Amplitudes are plotted versus stimulus number. Average EPSCs (n = 10) taken at time points indicated by ad are shown on top.
Figure 4
Figure 4. NMDA EPSC fatigue at previously unstimulated (naive) developing PP–GC synapses
A, average NMDA EPSC fatigue in response to both single and paired-pulse stimulation (50 ms) at 0.2 Hz as a function of stimulus number (n = 16). Representative average EPSCs (n = 10) taken at the beginning (a) and the end (b) of the fatigue protocol are shown on top. B, low-frequency depression of NMDA EPSCs. Graph shows average (n = 6) decrease of NMDA EPSCs when switching from 0.033 to 0.2 Hz. Before averaging, the EPSCs in each experiment were normalized with respect to the average EPSC amplitude evoked at 0.033 Hz. Representative average EPSCs (n = 10) taken at time points indicated by a and b are shown on top.
Figure 5
Figure 5. Interaction between synaptic fatigue induced at −80 and +40 mV
A, an experiment illustrating sequential recordings of naive NMDA EPSCs (at +40 mV) and AMPA EPSCs (at −80 mV). Note the difference in variability between NMDA (1/CV2 = 213) and AMPA (1/CV2 = 43) EPSCs. B, AMPA EPSCs evoked after the preceding fatigue protocol at +40 mV. AMPA EPSC amplitude is plotted versus stimulus number (n = 7). C, an experiment illustrating sequential recordings of naive AMPA EPSCs (at −80 mV) and NMDA EPSCs (at +40 mV). Note the difference in variability between NMDA (1/CV2 = 200) and AMPA (1/CV2 = 61) EPSCs. D, NMDA EPSCs evoked after the preceding fatigue protocol at −80 mV. NMDA EPSC amplitude is plotted versus stimulus number (n = 17).
Figure 6
Figure 6. Comparison of 1/CV2 for AMPA and NMDA EPSC
A, an experiment illustrating sequential recordings of naive AMPA EPSCs (at −80 mV) and NMDA EPSCs (at +40 mV). Data points for calculation of 1/CV2 for late AMPA and NMDA EPSCs were taken at time intervals indicated in the graph. The EPSCs evoked during these time intervals are shown as insets above. In this experiment the 1/CV2 for late AMPA and NMDA EPSCs were 11 and 16, respectively. B, bar graph comparing difference in 1/CV2 between AMPA and NMDA EPSCs with AMPA silencing. Left bar shows the percentage of AMPA signalling synapses left after AMPA silencing. These values were taken from experiments (n = 9) such as that illustrated in Fig. 2A, in which the AMPA silencing component was obtained in isolation from the low-frequency depression. Right bar shows the relative percentage of 1/CV2late AMPA to 1/CV2NMDA from experiments (n = 17) such as that illustrated in A.
Figure 7
Figure 7. Synaptic fatigue in adult PP–GC synapses
A, AMPA EPSC fatigue evoked at 0.2 Hz at previously unstimulated (naive) adult (30- to 47-day-old rats) PP–GC synapses (n = 10). B, AMPA EPSC fatigue evoked at 0.2 Hz followed by recovery after switching to 0.033 Hz (n = 5). Representative average EPSCs (n = 10) taken at time points indicated by ac are shown as insets.
Figure 8
Figure 8. Relationship between low-frequency depression and paired-pulse plasticity
A, there is no change in paired-pulse ratio in association with low-frequency depression. Average paired-pulse ratio during low-frequency depression is plotted as a function of stimulus number. The paired-pulse ratio measurements were constructed as ratios between average (n = 19 experiments) second and first EPSCs. The dashed line is an average of the first 10 measurements evoked at 0.033 Hz. B, low-frequency depression is not correlated with paired-pulse plasticity. The amount of low-frequency depression measured using field EPSPs is plotted against the paired-pulse ratio (n = 9). The dashed line represents a linear regression through the data points (r=−0.16, P > 0.05).
Figure 9
Figure 9. Estimation of vesicle pool size during low-frequency depression
A, examples of average (n = 10) responses to 10-impulse 50-Hz stimulation trains evoked at 0.033 Hz (dashed line) and at 0.2 Hz (continuous line). B, bar graph showing the average change of the AMPA EPSC when using single (n = 10), paired-pulse (PP) (n = 19) and train (n = 7) stimulation. C, average AMPA EPSC amplitudes in response to 10-impulse 50-Hz stimulation trains evoked at 0.033 Hz (○) and at 0.2 Hz (•). AMPA EPSC amplitudes are plotted versus stimulus number in the 50-Hz train and they were normalized to the first EPSC in the train evoked at 0.033 Hz before averaging. Filled circles connected by dashed line is the same as filled circles connected with continuous line, but scaled such that the first EPSC amplitude in the train is 100%. D, cumulative AMPA EPSC amplitude during 50-Hz train stimulation based on the EPSC amplitudes in C. Dashed lines are extrapolations from linear regression over the last five data points. Intersection between dashed line and the y-axis represents a lower-limit estimation of the pool size. Dotted lines are the horizontal extrapolation from the point where the linear regression line and the cumulative amplitude curve deviate. Intersection between dotted line and the y-axis represents an upper-limit estimation of the pool size.

Similar articles

Cited by

References

    1. Altman J, Das GD. Post-natal origin of microneurones in the rat brain. Nature. 1965;207:953–956. - PubMed
    1. Castellucci VF, Kandel ER. A quantal analysis of the synaptic depression underlying habituation of the gill-withdrawal reflex in Aplysia. Proc Natl Acad Sci U S A. 1974;71:5004–5008. - PMC - PubMed
    1. Christoffersen GR. Habituation: events in the history of its characterization and linkage to synaptic depression. A new proposed kinetic criterion for its identification. Prog Neurobiol. 1997;53:45–66. - PubMed
    1. Clements JD. A statistical test for demonstrating a presynaptic site of action for a modulator of synaptic amplitude. J Neurosci Methods. 1990;31:75–88. - PubMed
    1. Gover TD, Jiang XY, Abrams TW. Persistent, exocytosis-independent silencing of release sites underlies homosynaptic depression at sensory synapses in Aplysia. J Neurosci. 2002;22:1942–1955. - PMC - PubMed

Publication types

MeSH terms

Substances

LinkOut - more resources