. 2006 Mar;24(3):547-56.
doi: 10.1634/stemcells.2005-0194. Epub 2005 Oct 20.

Cell cycle features of primate embryonic stem cells

Affiliations

Cell cycle features of primate embryonic stem cells

Anne-Catherine Fluckiger et al. Stem Cells. 2006 Mar.

Abstract

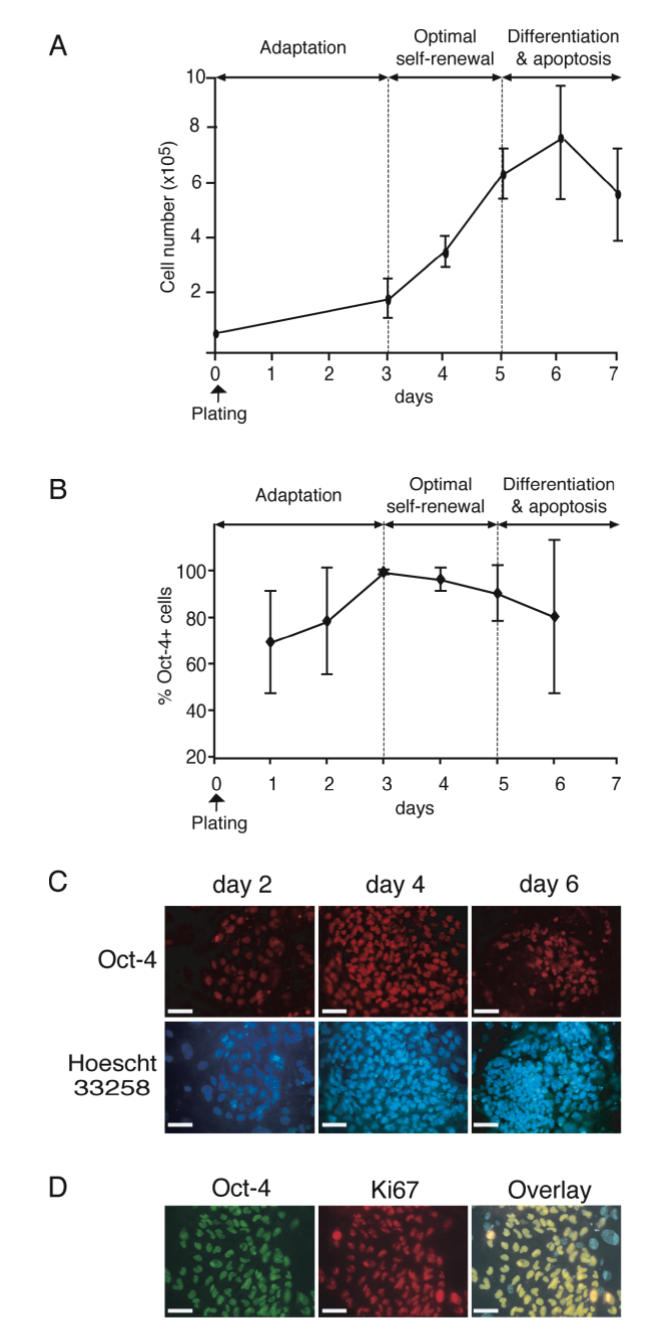
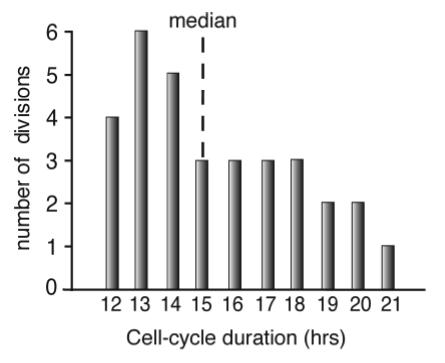
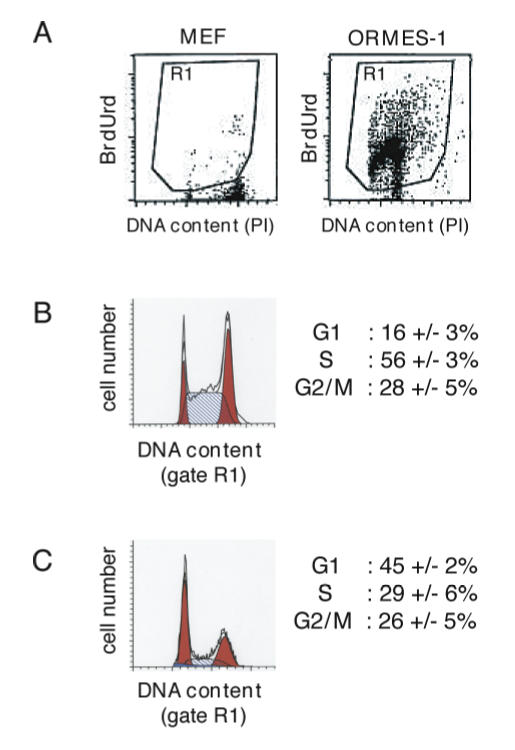
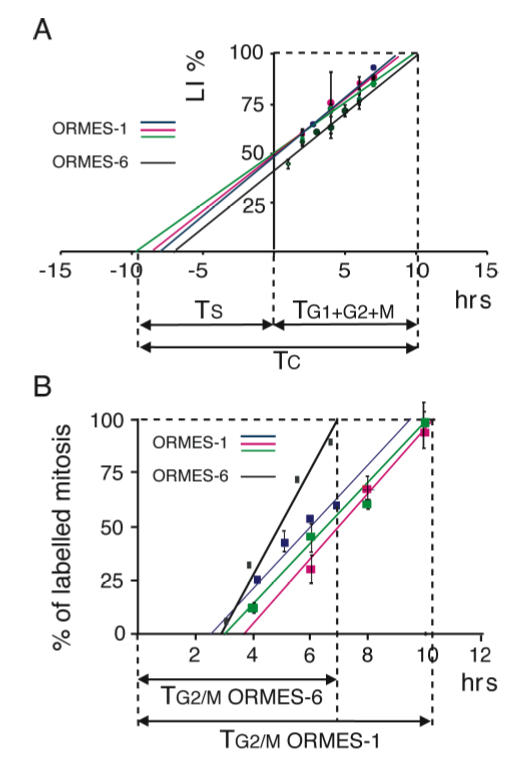
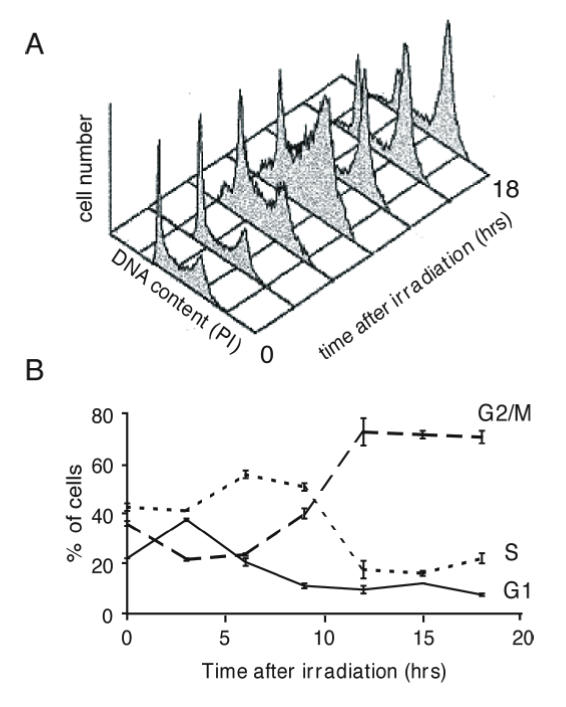
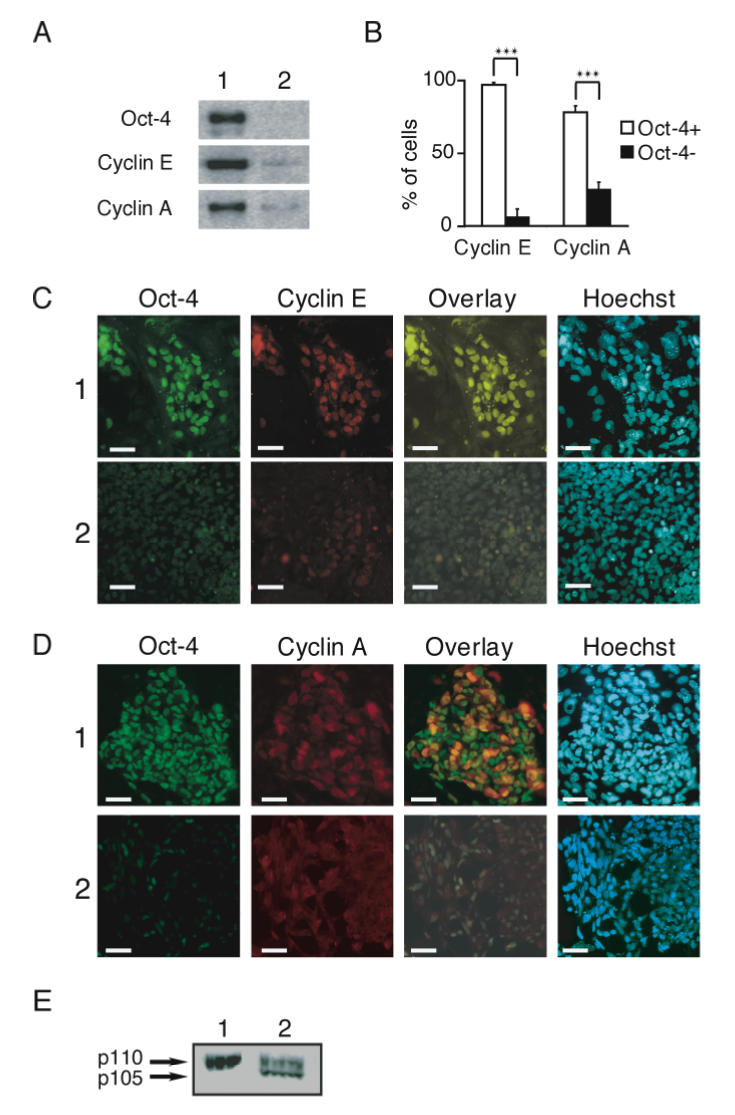
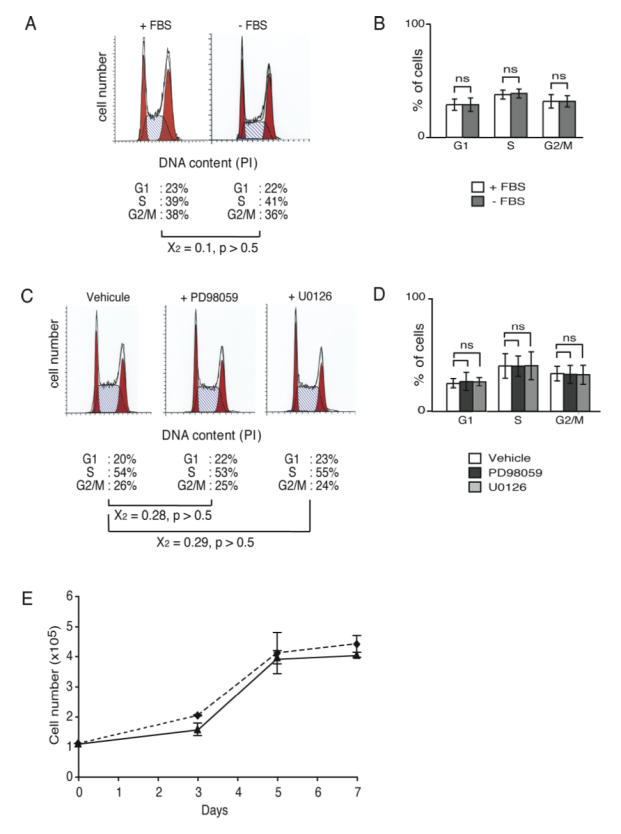
Using flow cytometry measurements combined with quantitative analysis of cell cycle kinetics, we show that rhesus monkey embryonic stem cells (ESCs) are characterized by an extremely rapid transit through the G1 phase, which accounts for 15% of the total cell cycle duration. Monkey ESCs exhibit a non-phasic expression of cyclin E, which is detected during all phases of the cell cycle, and do not growth-arrest in G1 after gamma-irradiation, reflecting the absence of a G1 checkpoint. Serum deprivation or pharmacological inhibition of mitogen-activated protein kinase kinase (MEK) did not result in any alteration in the cell cycle distribution, indicating that ESC growth does not rely on mitogenic signals transduced by the Ras/Raf/MEK pathway. Taken together, these data indicate that rhesus monkey ESCs, like their murine counterparts, exhibit unusual cell cycle features in which cell cycle control mechanisms operating during the G1 phase are reduced or absent.


Figures

Figure 1
Figure 1
Population doubling time and expression of Oct-4 and Ki67 markers in ORMES-1 cells. ORMES cells were plated on inactivated MEF at a density of 0.3 × 10⁵ cells per cm2. (A) Cell numbers were counted at each time point (2 to 3 replicates) in two independent experiments using a Trypan blue exclusion assay. Means and standard errors to the mean (SEM) are indicated on the graph. (B) Immunohistofluorescent detection of Oct-4 (revealed by Cy3) in undifferentiated ORMES-1 cells between day 1 and day 6 of culture. Curve represents the mean percentages of Oct-4+ cells within colonies (n = 7 to 14) of ORMES-1 cells. (C) Immunohistofluorescent detection of Oct-4 (revealed by Cy3) in ORMES-1 cells at day 2, 4 and 6 of the culture (D) Immunohistofluorescent detection of Oct-4 (revealed by Cy2) and Ki-67 (revealed by phycoerythrine) in ORMES-1 cells at day 3 of the culture. (C,D) Bar = 10 μM.
Figure 2
Figure 2
Cell-cycle duration of individual ORMES-1 cells measured by time lapse videomicroscopy two passages after infection with lentiviral vector expressing eGFP. Histogram represents the duration of 32 individual cell divisions over a time period of 48 hrs.
Figure 3
Figure 3
Cell-cycle distribution of ORMES-1 cells as measured by flow cytometry. ORMES-1 cells were grown in the presence of 50 μM BrdUrd for 24 hrs to label all proliferating cells. Cells were then processed for detection of BrdUrd incorporation and analysis of DNA content. (A) Dot plot representation of DNA/BrdUrd biparametric analysis for ORMES-1 and inactivated MEF. DNA was stained with propidium iodide (PI) (x-axis) and BrdUrd (y-axis) was revealed with FITC-conjugated anti-BrdUrd. (B) Histogram representation of the cell-cycle distribution of ORMES-1 cells gated as the BrdUrd+ cell population (gate R1). (C) Histogram representation of the cell-cycle distribution of ORMES-1 after differentiation induced by withdrawal of MEF and culture on gelatine-coated dishes for 1 week. (B,C) Histograms show one representative experiment. Values are means and SEM calculated from three independent replicates. Frequencies of cells in each phase of the cell-cycle were calculated using MODFIT software.
Figure 4
Figure 4
Duration of individual phases of the ORMES-1 and ORMES-6 cell-cycle by means of cumulative BrdUrd incorporation and Percentage of Labelled Mitosis (PLM) techniques. (A) Determination of Tc (length of the total cell-cycle), Ts (length of the S-phase) and TG1+G2+M (length of the G1+G2+M phases) by cumulative BrdUrd incorporation. ORMES-1 and ORMES-6 cells were plated at a density of 0.3 × 10⁵ cells per cm2. Three days after plating, cells were refed with fresh medium containing 50 μM BrdUrd, further cultured for 1 to 10 hours, then processed at regular time intervals for dual detection of Oct-4 expression and BrdUrd incorporation. The four curves correspond to the percentages of BrdUrd+/Oct4+ cells (labelling indices, LI) calculated in four independent experiments [three experiments carried on ORMES-1 (red, green and blue curves), and one experiment carried out on ORMES-6 (black curve)]. For each curve, values are means and SEM calculated from 3 replicates (replicates are sister coverslips from which individual LI are calculated). Projection of the extrapolated 100% LI value on the x-axis returns the duration of G1+G2+M phases (TG1+G2+M). Projection on the negative limb of the axis returns the duration of the S-phase (Ts). (B) Determination of TG2/M (length of G2/M) by the PLM technique. ORMES-1 and ORMES-6 cells were plated at a density of 0.3 × 10⁵ cells per cm2. Three days after plating, cells were exposed to 50 μM BrdUrd for 1 hr and further cultured for 1 to 10 hrs in BrdU-free medium. At regular time intervals, cells were processed for dual detection of Oct-4 expression and BrdUrd incorporation. The curves indicates the percentages of BrdUrd+/Oct4+ mitosis in four independent experiments [three experiments on ORMES-1 (red, green and blue curves), and one experiment on ORMES-6 (black curve)]. For each curve, values are means and SEM calculated from 2–3 replicates (replicates are sister coverslips from which individual percentages are calculated). Projection of the extrapolated 100% value on the x-axis returns the duration of (TG2+M). The G1 duration has been calculated by substraction of TG2+M from TG1+G2/M using values obtained from sister cultures, which values are indicated in the same color code (i.e. the red curves in A and in B come from sister cultures).
Figure 5
Figure 5
DNA damage checkpoints in ORMES-1 cells. ORMES-1 cells were plated at a density of 0.3 × 10⁵ cells per cm2 on MEF. Three days after plating, cells were irradiated (6 Gy) and further cultured for 3 to 18 hrs before being processed for analysis of DNA content by flow cytometry. (A) Cell-cycle distributions of irradiated ORMES-1 cells as measured 0 to 24 hrs after irradiation. (B) Percentages of ORMES-1 cells in G1, S and G2/M phases of the cell-cycle as a function of time following irradiation (means and SEM were calculated from three independent experiments). Percentages were calculated using MODFIT software.
Figure 6
Figure 6
Expression of cyclin E, cyclin A, and pRB in ORMES-1 cells. (A) Western blot analysis of the steady-state levels of cyclin E and cyclin A in undifferentiated ORMES-1 cells (1) and in their differentiated derivatives (2). Differentiation was achieved by plating ORMES-1 cells at high density on feeder-free, gelatin-coated culture dishes for 5 days, with reduced serum (5%). (B) Percentages of cyclin E and cyclin A positive cells in Oct-4+ ES cells and Oct-4 ES-derived cells calculated after immunohistofluorescence. 2 coverslips were examined for both cyclin E and cyclin A expression. The percentage of cyclin E+ cells was estimated on 590 Oct-4+ cells and 848 Oct-4 cells. A total of 580 Oct-4+ cells and 1123 Oct-4 cells were counted to determine the percentage of cells expressing cyclin A expression. ***: p < 0.001 (Student T-test). (C) Immunohistofluorescent detection of Oct-4 (revealed by Cy2) and cyclin E (revealed by Cy3) in undifferentiated ORMES-1 cells (panel 1) or in differentiated ORMES-1 cells (panel 2). (D) Immunohistofluorescent detection of Oct-4 (revealed by Cy2) and cyclin A (revealed by Cy3) in undifferentiated ORMES-1 cells (panel 1) or in differentiated ORMES-1 cells (panel 2). Western blot analysis of pRB expression in undifferentiated ORMES-1 ES cells (1), in embryonic fibroblasts (2). p105 and p110 indicate molecular weights of hypophosphorylated and hyperphosphorylated pRB, respectively. (C,D) Bar = 10 μM.
Figure 7
Figure 7
Dependency on serum stimulation and MEK signaling of ORMES-1 cells. ORMES-1 cells were plated at a density of 0.3 × 10⁵ cells per cm2. (A–D) Two days after plating, cells were refed with fresh medium lacking serum, or containing the MEK inhibitors PD98059 (PD98) or U0126, or vehicle (DMSO) alone, and further cultured for 24 hrs. Cells were then processed for DNA analysis by flow cytometry. Percentages of cells in each phase of the cell-cycle were calculated using MODFIT software. (A) Cell-cycle distribution of ORMES-1 cells cultured in the presence (+ FBS) or in the absence (−FBS) of serum (one representative expriment). Distributions are compared by means of X2 test. (B) Histograms showing the percentages of ORMES-1 cells in G1, S and G2/M phases (+/− FBS). Means and SEM were calculated from three independent experiments and compared by means of Student T-test. ns, non significant. (C) Cell-cycle distribution of ORMES-1 cells cultured in the presence of 25 μM PD98059, or 10 μM U0126, or in vehicle alone (one representative experiment). Distributions are compared by means of X2 test. (D) Histograms showing the percentages of ORMES-1 cells in G1, S and G2/M phases (+/− MEK inhibitors). Means and SEM were calculated from three independent experiments and compared by means of Student T-test. ns, non significant. (E) ORMES-1 cells were propagated in the presence of PD98059 (dotted line), or in vehicle alone (plain line), for 7 days. Cell numbers were counted at the indicated time points using a Trypan blue exclusion assay. Means and SEM were calculated from two replicates.

References

    1. Savatier P, Lapillonne H, van Grunsven LA, et al. Withdrawal of differentiation inhibitory activity/leukemia inhibitory factor up-regulates D-type cyclins and cyclin-dependent kinase inhibitors in mouse embryonic stem cells. Oncogene. 1996;12:309–309. - PubMed
    1. Dannenberg JH, van Rossum A, Schuijff L, et al. Ablation of the retinoblastoma gene family deregulates G(1) control causing immortalization and increased cell turnover under growth-restricting conditions. Genes Dev. 2000;14:3051–3051. - PMC - PubMed
    1. Sage J, Mulligan GJ, Attardi LD, et al. Targeted disruption of the three Rb-related genes leads to loss of G(1) control and immortalization. Genes Dev. 2000;14:3037–3037. - PMC - PubMed
    1. Burdon T, Smith A, Savatier P. Signalling, cell cycle and pluripotency in embryonic stem cells. Trends Cell Biol. 2002;12:432. - PubMed
    1. White J, Stead E, Faast R, et al. Developmental Activation of the Rb-E2F Pathway and Establishment of Cell Cycle Regulated Cdk Activity During Embryonic Stem Cell Differentiation. Mol Biol Cell. 2005;16:2018–2018. - PMC - PubMed

Publication types