

Micro-Raman spectroscopy detects individual neoplastic and normal hematopoietic cells
- PMID: 16239327
- PMCID: PMC1367069
- DOI: 10.1529/biophysj.105.066761
Micro-Raman spectroscopy detects individual neoplastic and normal hematopoietic cells
Abstract
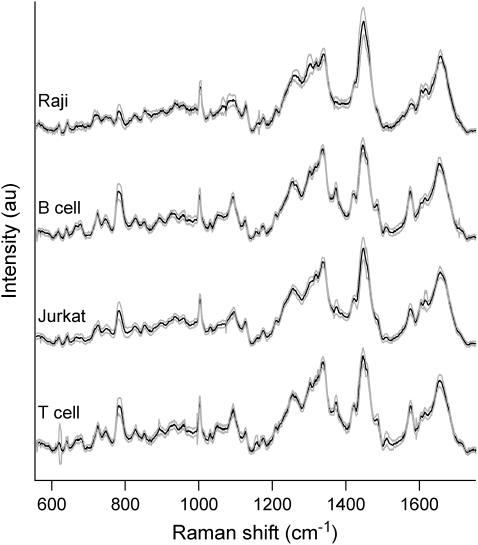
Current methods for identifying neoplastic cells and discerning them from their normal counterparts are often nonspecific, slow, biologically perturbing, or a combination thereof. Here, we show that single-cell micro-Raman spectroscopy averts these shortcomings and can be used to discriminate between unfixed normal human lymphocytes and transformed Jurkat and Raji lymphocyte cell lines based on their biomolecular Raman signatures. We demonstrate that single-cell Raman spectra provide a highly reproducible biomolecular fingerprint of each cell type. Characteristic peaks, mostly due to different DNA and protein concentrations, allow for discerning normal lymphocytes from transformed lymphocytes with high confidence (p << 0.05). Spectra are also compared and analyzed by principal component analysis to demonstrate that normal and transformed cells form distinct clusters that can be defined using just two principal components. The method is shown to have a sensitivity of 98.3% for cancer detection, with 97.2% of the cells being correctly classified as belonging to the normal or transformed type. These results demonstrate the potential application of confocal micro-Raman spectroscopy as a clinical tool for single cancer cell detection based on intrinsic biomolecular signatures, therefore eliminating the need for exogenous fluorescent labeling.
Figures


References
-
- Huang, Z. W., A. McWilliams, H. Lui, D. I. McLean, S. Lam, and H. S. Zeng. 2003. Near-infrared Raman spectroscopy for optical diagnosis of lung cancer. Int. J. Cancer. 107:1047–1052. - PubMed
-
- Schut, T. C. B., M. J. H. Witjes, H. Sterenborg, O. C. Speelman, J. L. N. Roodenburg, E. T. Marple, H. A. Bruining, and G. J. Puppels. 2000. In vivo detection of dysplastic tissue by Raman spectroscopy. Anal. Chem. 72:6010–6018. - PubMed
-
- Krishna, C. M., G. D. Sockalingum, J. Kurien, L. Rao, L. Venteo, M. Pluot, M. Manfait, and V. B. Kartha. 2004. Micro-Raman spectroscopy for optical pathology of oral squamous cell carcinoma. Appl. Spectrosc. 58:1128–1135. - PubMed
-
- Crow, P., J. S. Uff, J. A. Farmer, M. P. Wright, and N. Stone. 2004. The use of Raman spectroscopy to identify and characterize transitional cell carcinoma in vitro. BJU Int. 93:1232–1236. - PubMed
-
- Frank, C. J., R. L. Mccreery, and D. C. B. Redd. 1995. Raman-spectroscopy of normal and diseased human breast tissues. Anal. Chem. 67:777–783. - PubMed
Publication types
MeSH terms
Substances
LinkOut - more resources
Full Text Sources
Other Literature Sources
Medical
