

Increased glucose tolerance and reduced adiposity in the absence of fasting hypoglycemia in mice with liver-specific Gs alpha deficiency
- PMID: 16239968
- PMCID: PMC1257533
- DOI: 10.1172/JCI24196
Increased glucose tolerance and reduced adiposity in the absence of fasting hypoglycemia in mice with liver-specific Gs alpha deficiency
Abstract
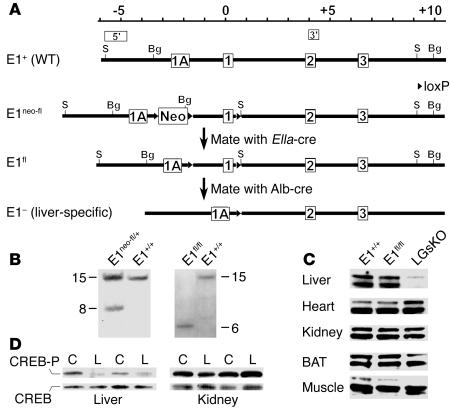
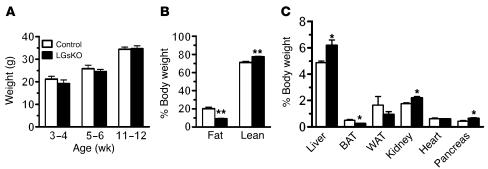
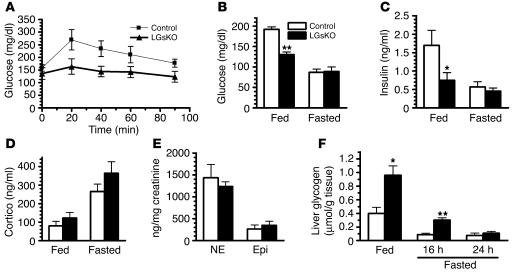
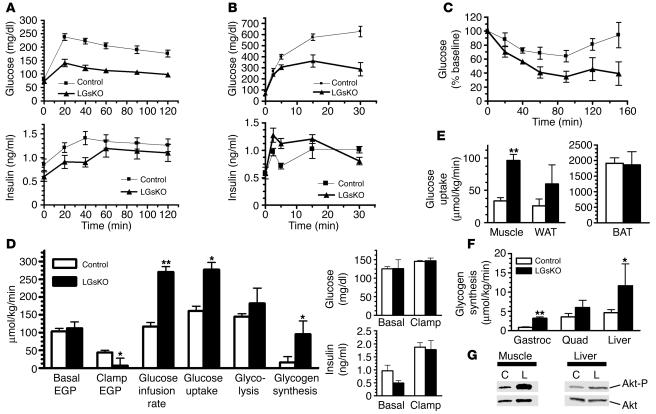
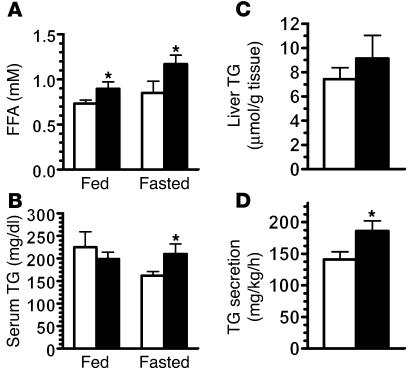
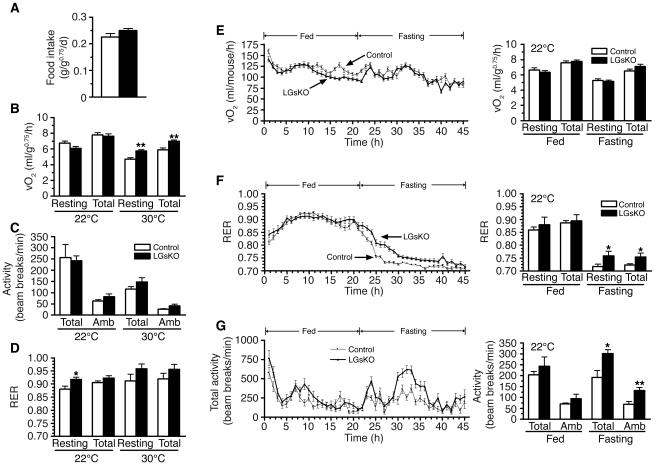
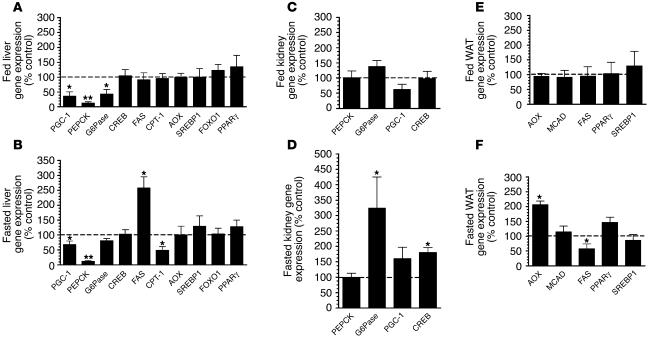
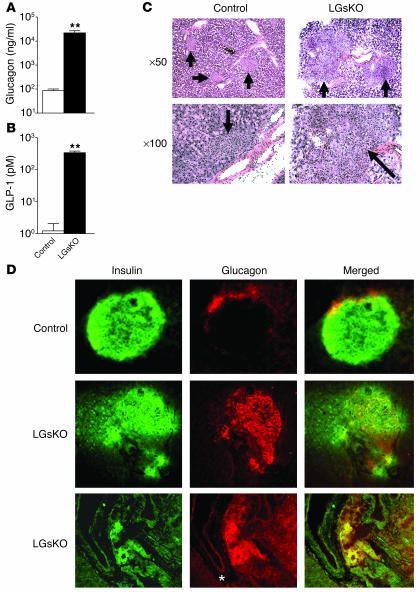
The G protein G(s)alpha is essential for hormone-stimulated cAMP generation and is an important metabolic regulator. We investigated the role of liver G(s)-signaling pathways by developing mice with liver-specific G(s)alpha deficiency (LGsKO mice). LGsKO mice had increased liver weight and glycogen content and reduced adiposity, whereas survival, body weight, food intake, and metabolic rates at ambient temperature were unaffected. LGsKO mice had increased glucose tolerance with both increased glucose-stimulated insulin secretion and increased insulin sensitivity in liver and muscle. Fed LGsKO mice were hypoglycemic and hypoinsulinemic, with low expression of hepatic gluconeogenic enzymes and PPARgamma coactivator-1. However, LGsKO mice maintained normal fasting glucose and insulin levels, probably due to prolonged breakdown of glycogen stores and possibly increased extrahepatic gluconeogenesis. Lipid metabolism was unaffected in fed LGsKO mice, but fasted LGsKO mice had increased lipogenic and reduced lipid oxidation gene expression in liver and increased serum triglyceride and FFA levels. LGsKO mice had very high serum glucagon and glucagon-like peptide-1 levels and pancreatic alpha cell hyperplasia, probably secondary to hepatic glucagon resistance and/or chronic hypoglycemia. Our results define novel roles for hepatic G(s)-signaling pathways in glucose and lipid regulation, which may prove useful in designing new therapeutic targets for diabetes and obesity.
Figures
Similar articles
-
Absence of the glucagon-like peptide-1 receptor does not affect the metabolic phenotype of mice with liver-specific G(s)α deficiency.Endocrinology. 2011 Sep;152(9):3343-50. doi: 10.1210/en.2011-0012. Epub 2011 Jul 19. Endocrinology. 2011. PMID: 21771891 Free PMC article.
-
Impaired glucose tolerance and predisposition to the fasted state in liver glycogen synthase knock-out mice.J Biol Chem. 2010 Apr 23;285(17):12851-61. doi: 10.1074/jbc.M110.106534. Epub 2010 Feb 23. J Biol Chem. 2010. PMID: 20178984 Free PMC article.
-
Metabolism and insulin signaling in common metabolic disorders and inherited insulin resistance.Dan Med J. 2014 Jul;61(7):B4890. Dan Med J. 2014. PMID: 25123125 Review.
-
Increased glucose tolerance in N-type Ca2+ channel alpha(1B)-subunit gene-deficient mice.Int J Mol Med. 2005 Jun;15(6):937-44. Int J Mol Med. 2005. PMID: 15870896
-
[Glucagon and glucagon-like peptides the role in control glucose homeostasis. Part I].Pediatr Endocrinol Diabetes Metab. 2011;17(4):215-21. Pediatr Endocrinol Diabetes Metab. 2011. PMID: 22248782 Review. Polish.
Cited by
-
Inhibition of β1-AR/Gαs signaling promotes cardiomyocyte proliferation in juvenile mice through activation of RhoA-YAP axis.Elife. 2022 Dec 8;11:e74576. doi: 10.7554/eLife.74576. Elife. 2022. PMID: 36479975 Free PMC article.
-
Gnas Loss Causes Chondrocyte Fate Conversion in Cranial Suture Formation.J Dent Res. 2022 Jul;101(8):931-941. doi: 10.1177/00220345221075215. Epub 2022 Feb 26. J Dent Res. 2022. PMID: 35220829 Free PMC article.
-
Hyperaminoacidemia induces pancreatic α cell proliferation via synergism between the mTORC1 and CaSR-Gq signaling pathways.Nat Commun. 2023 Jan 16;14(1):235. doi: 10.1038/s41467-022-35705-4. Nat Commun. 2023. PMID: 36646689 Free PMC article.
-
Dose threshold for radiation induced fetal programming in a mouse model at 4 months of age: Hepatic expression of genes and proteins involved in glucose metabolism and glucose uptake in brown adipose tissue.PLoS One. 2020 Apr 21;15(4):e0231650. doi: 10.1371/journal.pone.0231650. eCollection 2020. PLoS One. 2020. PMID: 32315370 Free PMC article.
-
Disturbed flow-induced Gs-mediated signaling protects against endothelial inflammation and atherosclerosis.JCI Insight. 2020 Dec 3;5(23):e140485. doi: 10.1172/jci.insight.140485. JCI Insight. 2020. PMID: 33268595 Free PMC article.
References
-
- DeFronzo RA. Pathogenesis of type 2 diabetes: metabolic and molecular implications for identifying diabetes genes. Diabetes Rev. 1997;5:177–269.
-
- Reaven GM, Chen YD, Golay A, Swislocki AL, Jaspan JB. Documentation of hyperglucagonemia throughout the day in nonobese and obese patients with noninsulin-dependent diabetes mellitus. J. Clin. Endocrinol. Metab. 1987;64:106–110. - PubMed
-
- Liang Y, et al. Reduction in glucagon receptor expression by an antisense oligonucleotide ameliorates diabetic syndrome in db/db mice. Diabetes. 2004;53:410–417. - PubMed
-
- Parker JC, Andrews KM, Allen MR, Stock JL, McNeish JD. Glycemic control in mice with targeted disruption of the glucagon receptor gene. Biochem. Biophys. Res. Comm. 2002;290:839–843. - PubMed
Publication types
MeSH terms
Substances
Grants and funding
LinkOut - more resources
Full Text Sources
Other Literature Sources
Molecular Biology Databases
