. 2005 Nov;115(11):2979-91.
doi: 10.1172/JCI23298. Epub 2005 Oct 20.

Infiltration of COX-2-expressing macrophages is a prerequisite for IL-1 beta-induced neovascularization and tumor growth

Affiliations

Infiltration of COX-2-expressing macrophages is a prerequisite for IL-1 beta-induced neovascularization and tumor growth

Shintaro Nakao et al. J Clin Invest. 2005 Nov.

Abstract

Inflammatory angiogenesis is a critical process in tumor progression and other diseases. The inflammatory cytokine IL-1beta promotes angiogenesis, tumor growth, and metastasis, but its mechanisms remain unclear. We examined the association between IL-1beta-induced angiogenesis and cell inflammation. IL-1beta induced neovascularization in the mouse cornea at rates comparable to those of VEGF. Neutrophil infiltration occurred on day 2. Macrophage infiltration occurred on days 4 and 6. The anti-Gr-1 Ab-induced depletion of infiltrating neutrophils did not affect IL-1beta- or VEGF-induced angiogenesis. The former was reduced in monocyte chemoattractant protein-1-deficient (MCP-1(-/-)) mice compared with wild-type mice. After day 4, clodronate liposomes, which kill macrophages, reduced IL-1beta-induced angiogenesis and partially inhibited VEGF-induced angiogenesis. Infiltrating macrophages near the IL-1beta-induced neovasculature were COX-2 positive. Lewis lung carcinoma cells expressing IL-1beta (LLC/IL-1beta) developed neovasculature with macrophage infiltration and enhanced tumor growth in wild-type but not MCP-1(-/-) mice. A COX-2 inhibitor reduced tumor growth, angiogenesis, and macrophage infiltration in LLC/IL-1beta. Thus, macrophage involvement might be a prerequisite for IL-1beta-induced neovascularization and tumor progression.


Figures
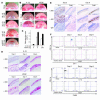
Figure 1
Figure 1
IL-1β– and VEGF-induced angiogenesis and inflammatory cell infiltration in mouse corneas. (A) Neovascularization 6 days after implanting Hydron pellets containing human or mouse IL-1β or mouse VEGF at the doses shown into male BALB/c mouse corneas. hIL-1β, human IL-1β; mIL-1β, mouse IL-1β; mVEGF, mouse VEGF. (B) Corneal neovascularization induced by human IL-1β (30 ng) or mouse VEGF (200 ng) at the indicated time points. (C) Quantitative analysis of neovascularization on days 4 (white bars) and 6 (black bars). Areas are expressed in mm2. Bars show the mean ± SD of independent experiments (n = 6 or 7). (D) Corneas implanted with IL-1β or VEGF stained by H&E at the indicated time points. (E) Corneal sections on days 2 or 6 after IL-1β–pellet implantation, labeled immunohistochemically (brown) for Gr-1, which was detected in infiltrating cells on days 2 and 6, and F4/80, which was detected on day 6. (F) FACS analysis of infiltrating cells from IL-1β– or VEGF-implanted corneas (n = 5) at the indicated times. Cells were stained with PE-CD11b mAb and FITC–Gr-1 or FITC-F4/80 mAb. The percentages of infiltrating CD11b+Gr-1+ cells in IL-1β–implanted corneas were 53.5% ± 10.4% (day 2), 15.8% ± 4.9% (day 4), and 3.15% ± 0.27% (day 6). The percentages of infiltrating CD11b+Gr-1+ cells in VEGF-implanted corneas were 2.99% ± 1.37% (day 2), 1.95% ± 0.75% (day 4), and 1.08% ± 0.74% (day 6). The percentages of infiltrating CD11b+F4/80+ cells in IL-1β–implanted corneas were 1.85% ± 1.28% (day 2), 5.56% ± 1.61% (day 4), and 5.52% ± 1.14% (day 6). The percentages of infiltrating CD11b+F4/80+ cells in VEGF-implanted corneas were 0.81% ± 0.47% (day 2), 1.30% ± 1.03% (day 4), and 1.90% ± 0.98% (day 6).
Figure 2
Figure 2
The role of neutrophils in IL-1β– or VEGF-induced angiogenesis. (A) BALB/c mice received 200 μg neutralizing anti–Gr-1 mAb i.p. on days –1, 1, 3, and 5. Hydron pellets containing IL-1β (30 ng) or VEGF (200 ng) were implanted into the corneas on day 0. Corneal vessels in the region of the pellet implants were photographed at the indicated time points. (B) Anti–Gr-1 mAb did not suppress IL-1β– or VEGF-induced corneal neovascularization. Corneal neovascularization 6 days after treatment with anti–Gr-1 mAb (black bars) or control IgG (white bars) was quantified by area, in mm2. The bars show means ± SD of independent experiments (n = 3 or 4). (C) Corneas implanted with IL-1β stained by H&E at the indicated time points. Anti–Gr-1 mAb did not affect IL-1β–induced corneal edema on day 2. (D) FACS analysis of infiltrating cells after IL-1β implantation (n = 5) and treatment with anti–Gr-1 mAb or control IgG at the indicated times. The cells were stained with PE-CD11b mAb or FITC–Gr-1. The percentages of CD11b+Gr-1+ cells in IL-1β–implanted corneas of anti–Gr-1 mAb-treated mice were 0.25% ± 0.22% (day 2), 0.11% ± 0.1% (day 4), and 0.28% ± 0.37% (day 6). (E) FACS analysis of infiltrating cells from 5 IL-1β–implanted corneas treated with anti–Gr-1 mAb or control IgG at the indicated times. Cells were stained with PE-CD11b mAb or FITC-F4/80. The percentages of CD11b+F4/80+ cells in IL-1β–implanted corneas of anti–Gr-1 mAb-treated mice were 1.71% ± 1.04% (day 2), 4.36% ± 1.20% (day 4), and 5.57% ± 1.34% (day 6).
Figure 3
Figure 3
The role of MCP-1 in IL-1β– or VEGF-induced angiogenesis. (A) Kinetics of MCP-1 levels after pellet implantation. Corneal lysates were prepared and assayed by ELISA at the indicated times (n = 3). *P < 0.01 and **P < 0.03 versus untreated (N). (B) Kinetics of infiltrating macrophages in IL-1β–implanted corneas. Corneal lysates were prepared from untreated and IL-1β–treated corneas on the days shown (n = 3). Percentages of infiltrating F4/80+ cells were quantified using FACS. (C) Corneal neovascularization induced by IL-1β (30 ng) or VEGF (200 ng) in C57BL/6 wild-type and MCP-1–/– mice on day 6. (D) Corneal neovascularization at the indicated time points. (E) Quantitative analysis of IL-1β–induced corneal neovascularization in MCP-1–/– (n = 10) and wild-type mice (n = 8) on day 6. Bars show means ± SD. *P < 0.01 versus wild-type mice using the unpaired Student’s t test. (F) Immunohistochemistry for Gr-1 or F4/80 (brown) in corneal sections on day 6 after IL-1β pellet implantation in MCP-1–/– or wild-type mice. Gr-1–positive cells were detected in both types of mice. F4/80-positive cells were detected on day 6 in wild-type but not MCP-1–/– mice. (G) FACS analysis of infiltrating cells from 5 IL-1β– or VEGF-implanted corneas at day 6 in wild-type or MCP-1–/– mice. The percentages of CD11b+F4/80+ cells were 4.09% ± 2.13% (IL-1β, wild-type), 2.53% ± 1.73% (IL-1β, MCP-1–/–), 0.30% ± 0.10% (VEGF, wild-type), and 0.14% ± 0.05% (VEGF, MCP-1–/–). The percentages of CD11b+Gr-1+ cells were 13.5% ± 2.89% (IL-1β, wild-type), 7.84% ± 0.48% (IL-1β, MCP-1–/–), 0.94% ± 0.55% (VEGF, wild-type) and 0.20% ± 0.10% (VEGF, MCP-1–/–).
Figure 4
Figure 4
The effect of Cl2MDP-LIPs on IL-1β–induced angiogenesis. (A) FACS analysis of infiltrating cells on day 6, in IL-1β–implanted corneas from BALB/c mice that received Cl2MDP-LIPs or PBS-LIPs i.v. and/or s.c. The cells were stained with PE-CD11b mAb and FITC–Gr-1 or FITC-F4/80 mAb. (B) Corneal neovascularization at the indicated time points in BALB/c mice receiving Cl2MDP-LIPs or PBS-LIPs i.v. and/or s.c. The percentages of infiltrating cells in IL-1β–implanted corneas of Cl2MDP-LIP– or PBS-LIP–treated mice were 4.75% ± 0.48% (i.v., CD11b+F4/80+), 13.2% ± 4.03% (i.v., CD11b+Gr-1+), 1.63% ± 0.30% (i.v. + s.c., CD11b+F4/80+), and 6.61% ± 0.93% (i.v. + s.c., CD11b+Gr-1+). (C) Neovascularization was quantified by area in mm2 on day 4 (white bars) and day 6 (black bars). Bars show means ± SD of independent experiments (n = 3 or 4; *P < 0.01 and **P < 0.05 versus PBS-LIPs). (D) Corneal neovascularization induced with VEGF at the indicated time points after receiving Cl2MDP-LIPs or PBS-LIPs (i.v. + s.c.). (E) Quantitative analysis of neovascularization on day 6. VEGF-induced corneal neovascularization in mice (n = 6) receiving Cl2MDP-LIPs was inhibited compared with mice (n = 6) receiving PBS-LIPs. *P < 0.01 using the Student’s t test.
Figure 5
Figure 5
Expression of COX-2 in infiltrating macrophages during IL-1β–induced angiogenesis. (A) Corneal neovascularization on days 2, 4, and 6 in BALB/c mice receiving DFU. (B) Quantitative analysis of neovascularization on day 6. IL-1β–induced corneal neovascularization in mice (n = 5) receiving DFU was inhibited compared with control mice (n = 7). *P < 0.01 using Student’s t test. (C) Comparison of levels of PGE2 in IL-1β–implanted corneas with or without DFU. On day 4, 4 IL-1β–implanted corneas of DFU-treated and untreated mice were harvested. Corneal lysates were prepared and individually assayed for PGE2 (n = 3). **P < 0.05 using Student’s t test. (D) FACS analysis of infiltrating cells on day 6 from 5 IL-1β–implanted corneas from BALB/c mice receiving DFU and control mice. The percentages of CD11b+F4/80+ cells in mouse corneas were 4.63% ± 0.52% (control) and 3.45% ± 0.57% (DFU treated). (E) Representative overview of an IL-1β–implanted cornea on day 4. Arrowheads indicate infiltrated cells (yellow) that are positive for macrophage marker F4/80 (green) and COX-2 (red). L, limbus. Scale bar: 50 μm. (F) Corneal micropocket assay model in mice. The rectangle represents the area of the cornea used in the immunohistochemical analysis in E.
Figure 6
Figure 6
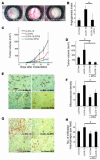
IL-1β–induced tumor angiogenesis in MCP-1–/– mice. (A) MCP-1 levels in the serum of LLC/IL-1β–grafted MCP-1–/– mice and wild-type mice 7 days after inoculation. MCP-1 was not detectable in the serum of LLC/neo-grafted mice by ELISA. Values are expressed as means ± SD of 5 samples. (B) IL-1β levels in the serum of LLC/IL-1β–grafted MCP-1–/– mice compared with wild-type mice 7 days after inoculation. *P < 0.01 using the unpaired Student’s t test. Values are expressed as means ± SD (n = 5). (C) Representative photographs of the dorsal air sac assay with LLC/neo and LLC/IL-1β in C57BL/6 wild-type and MCP-1–/– mice. (D) Quantitative analysis of the neovascularization induced by LLC/neo or LLC/IL-1β in the dorsal air sac in wild-type and MCP-1–/– mice. Mean angiogenetic activities ± SD for groups of mice (n = 5). *P < 0.01 versus LLC/IL-1β using the Mann-Whitney U test. (E) Mean tumor volumes ± SD for groups of wild-type mice (black and red) or MCP-1–/– mice (green and blue) implanted with 5 × 10⁵ LLC/IL-1β or LLC/neo cells (n = 5). (F) LLC/IL-1β tumor growth was not enhanced in MCP-1–/– mice (n = 10) compared with wild-type mice (n = 10; day 20). *P < 0.01 using the unpaired Student’s t test.
Figure 7
Figure 7
Enhancement of angiogenesis and macrophage infiltration by LLC/IL-1β was inhibited in MCP-1–/– mice (A) Representative photographs of CD31-stained sections from LLC tumors in wild-type or MCP-1–/– mice. Magnification, ×400. (B) CD31-positive microvascular densities obtained by morphometric analysis of LLC tumors. Each value represents the mean number of vessels ± SD in 5 fields. *P < 0.01 versus LLC/IL-1β. (C) Infiltration of macrophages stained with mAb F4/80 in LLC/neo and LLC/IL-1β tumors. Magnification, ×200. (D) Quantification of the number of macrophages infiltrating LLC/IL-1β and LLC/neo tumors. Magnification, ×400. Each value represents the mean number of macrophages ± SD in 5 microscopic fields. *P < 0.01 versus LLC/IL-1β in wild-type mice using the Mann-Whitney U test.
Figure 8
Figure 8
The effect of a COX-2 inhibitor on IL-1β–induced tumor angiogenesis. (A) Representative photographs of dorsal air sac assays in BALB/c mice with LLC/neo and LLC/IL-1β untreated or treated with DFU. (B) Quantitative analysis of the neovascularization induced by LLC/neo or LLC/IL-1β in the dorsal air sac assay in mice untreated or treated with DFU. Mean angiogenesis activities ± SD for groups of mice (n = 5). *P < 0.01 versus LLC/IL-1β. (C) Tumor volumes in wild-type mice implanted with 5 × 10⁵ LLC/IL-1β or LLC/neo cells, untreated or treated with DFU. (D) LLC/IL-β and LLC/neo tumor growth was inhibited in DFU-treated mice compared with control mice (day 20). *P < 0.01 using unpaired Student’s t test. (E) Representative photographs of CD31-stained tumor sections from LLC tumors grown in wild-type mice. Magnification, ×400. (F) CD31-positive microvascular densities from morphometric analysis of LLC tumors. Each value represents the mean number of vessels ± SD in 5 fields. *P < 0.01. (G) Infiltration of macrophages stained with mAb F4/80 in LLC/neo and LLC/IL-1β tumors in the mice indicated. Magnification, ×200. (H) Quantification of macrophages infiltrating LLC/IL-1β and LLC/neo tumors under the microscope. Magnification, ×400. Each value represents the mean number of macrophages ± SD in 5 fields. *P < 0.01 versus LLC/IL-1β wild-type mice using the Mann-Whitney U test.
Figure 9
Figure 9
The effect of anti-CXCR2 Ab on IL-1β–induced angiogenesis. Kinetics of protein expression for (A) VEGF-A, (B) KC (mouse CXCL1), and (C) MIP-2 (mouse CXCL2/3) after IL-1β pellet implantation. Four corneal lysates were prepared and assayed by ELISA on the indicated days (n = 3). *P < 0.01 versus untreated. (D) Expression of ENA-78 (CXCL5) mRNA levels in IL-1β–treated corneas. Six IL-1β–implanted corneas (IL-1β) or untreated corneas (N) were harvested, and real-time RT-PCR was performed to determine ENA-78 (CXCL5) mRNA levels on day 2. Expression was normalized to GAPDH mRNA levels. *P < 0.01 versus untreated. (E) Corneal neovascularization on days 2, 4, and 6 in BALB/c mice with or without i.p. administration of anti-mouse CXCR2 Ab. (F) Quantitative analysis of neovascularization on day 6. IL-1β–induced corneal neovascularization in mice (n = 6) receiving anti-mouse CXCR2 Ab was inhibited compared with mice (n = 6) receiving control goat serum. **P < 0.05 using Student’s t test. (G and H) Comparison of levels of VEGF-A (G) and KC (H) in IL-1β–implanted corneas with or without DFU. On day 4, corneal lysates were prepared from 4 IL-1β–implanted corneas from DFU-treated and untreated mice and individually assayed by ELISA for VEGF-A or KC (n = 3). **P < 0.05 using Student’s t test.
Figure 10
Figure 10
Model of the involvement of macrophages in IL-1β–induced angiogenesis in the tumor microenvironment. Monocytes/macrophages are expected to be recruited to the tumor environment in response to IL-1β and possibly other chemokines that attract macrophages. COX-2 activation is then induced, and the macrophages promote angiogenesis and tumor progression. Signaling molecules downstream of COX-2, PGE2, and TXA2 enhance the production of various angiogenesis-related factors (37, 38). IL-1β, IL-1α, and TNF-α enhance the expression of angiogenesis-related factors in cancer and vascular endothelial cells resulting from autocrine and/or paracrine controls in angiogenesis (5, 30, 55, 56). Monocytes/macrophages are recruited to the tumor environment in response to MCP-1 (and possibly MlP-1α, VEGF/PIGF, and CSF-1) accompanied by COX-2 activation in infiltrating macrophages by IL-1β (and possibly IL-1α and/or TNF-α). As a result, angiogenesis is enhanced by prostanoids (such as PGE2 and TXA2) as well as other angiogenic factors (such as VEGF, CXC chemokines, and MMPs). Clodronate blocks inflammatory angiogenesis induced by IL-1β.

Similar articles

Cited by

References

    1. Carmeliet P. Angiogenesis in health and disease. Nat. Med. 2003;9:653–660. - PubMed
    1. Rafii S, Lyden D. Therapeutic stem and progenitor cell transplantation for organ vascularization and regeneration. Nat. Med. 2003;9:702–712. - PubMed
    1. Dinarello CA. Biologic basis for interleukin-1 in disease. Blood. 1996;87:2095–2147. - PubMed
    1. Mantovani A, Bussolino F, Dejana E. Cytokine regulation of endothelial cell function. FASEB J. 1992;6:2591–2599. - PubMed
    1. Torisu H, et al. Macrophage infiltration correlates with tumor stage and angiogenesis in human malignant melanoma: possible involvement of TNFalpha and IL-1alpha. Int. J. Cancer. 2000;85:182–188. - PubMed

Publication types