. 2005 Oct;12(8):1047-64.
doi: 10.1089/cmb.2005.12.1047.

Comprehensive algorithm for quantitative real-time polymerase chain reaction

Affiliations

Comprehensive algorithm for quantitative real-time polymerase chain reaction

Sheng Zhao et al. J Comput Biol. 2005 Oct.

Abstract

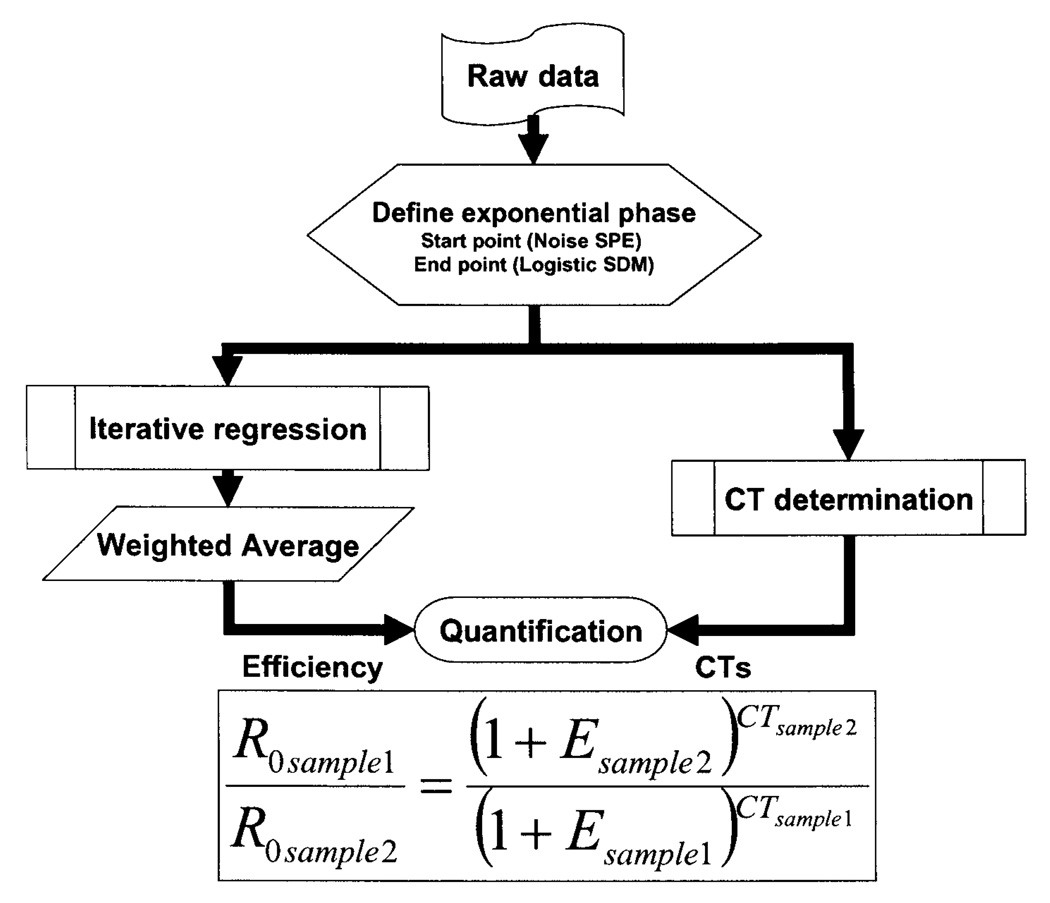
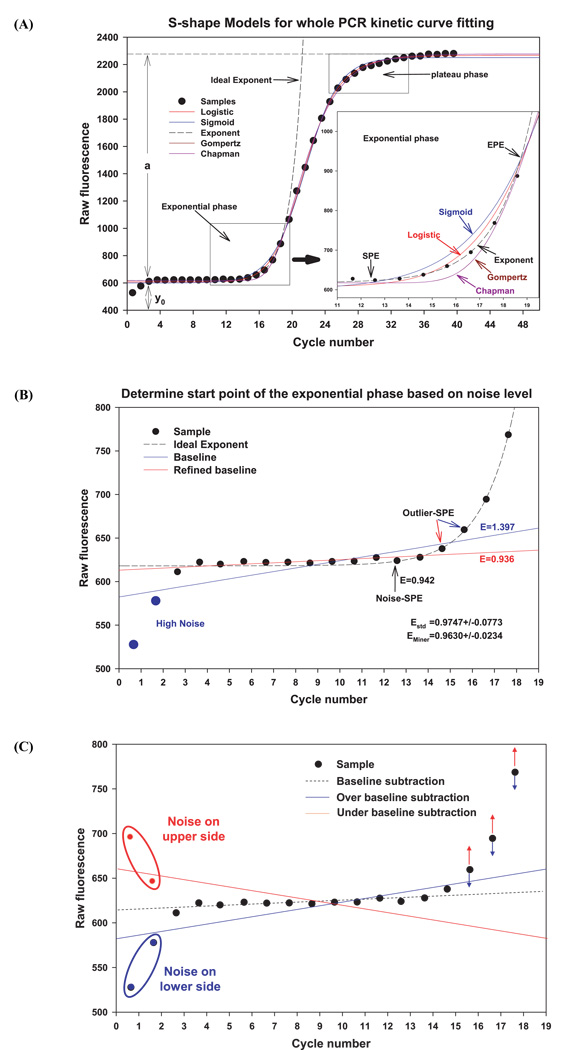
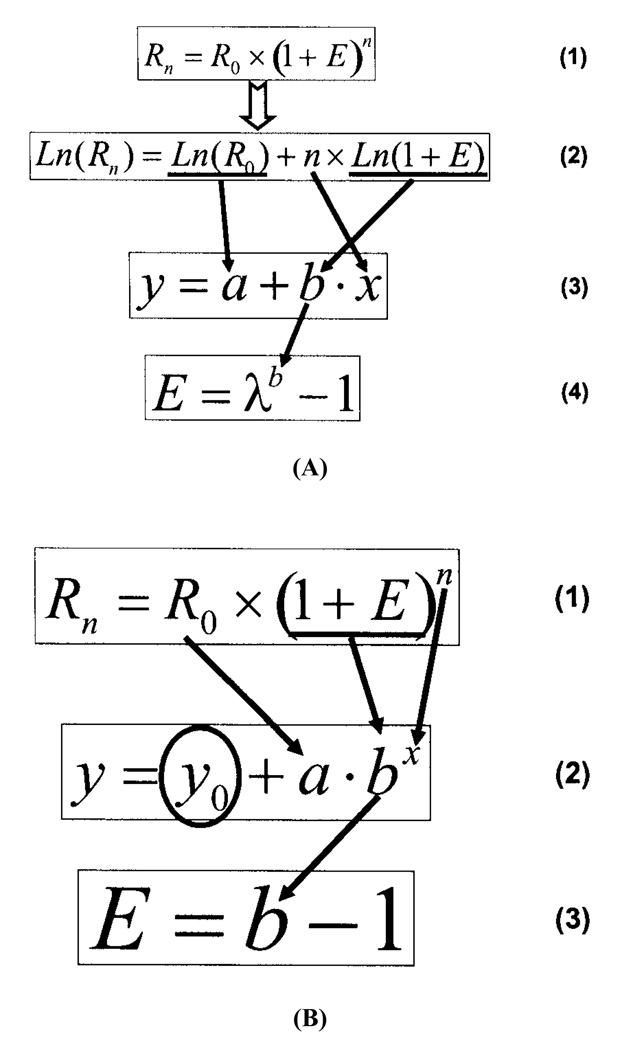
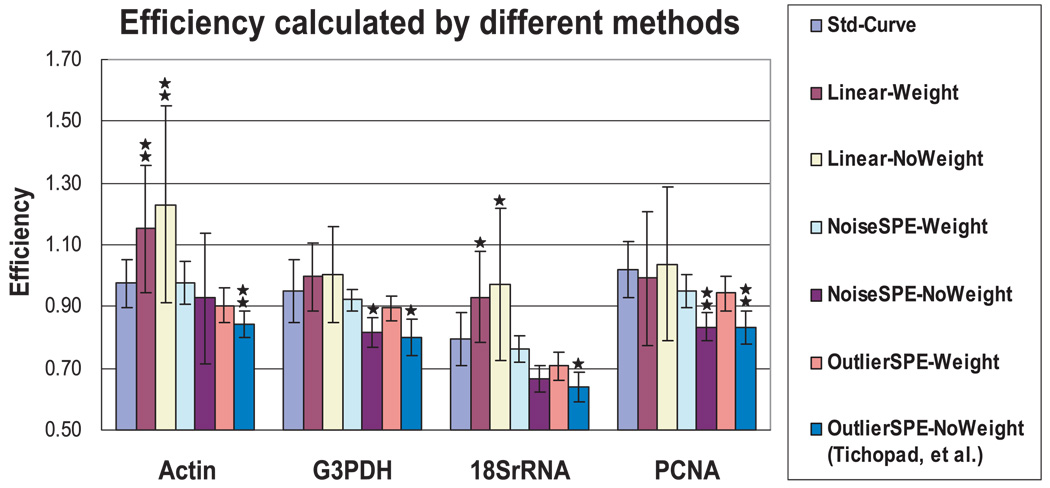
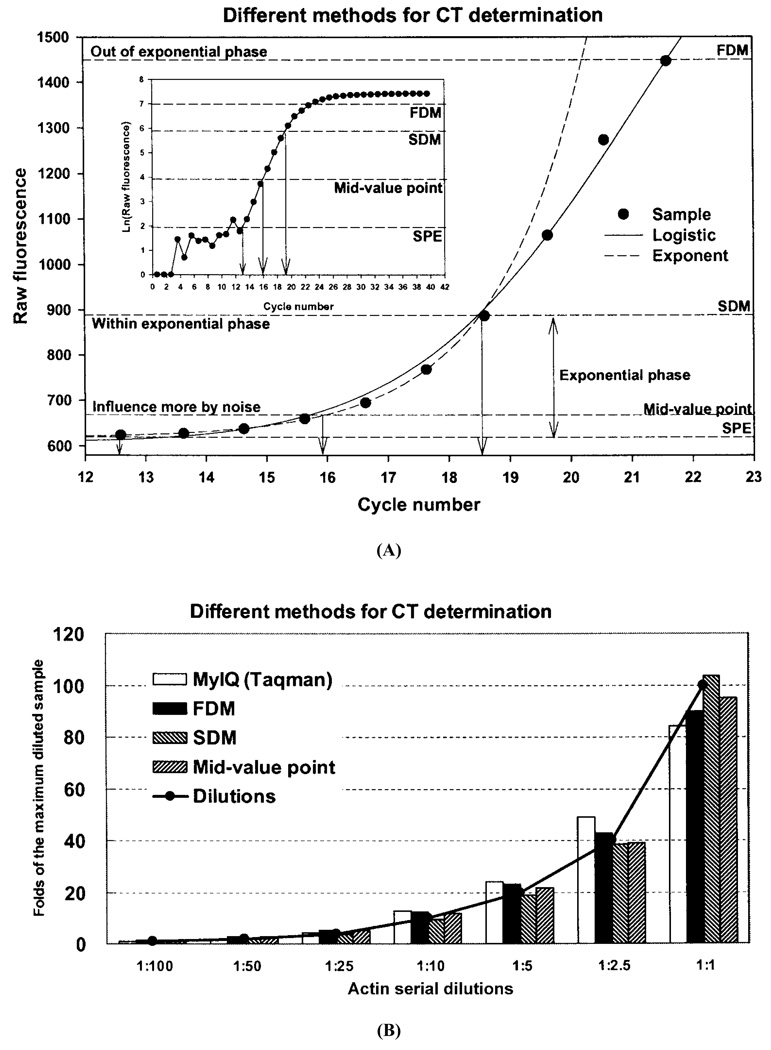
Quantitative real-time polymerase chain reactions (qRT-PCR) have become the method of choice for rapid, sensitive, quantitative comparison of RNA transcript abundance. Useful data from this method depend on fitting data to theoretical curves that allow computation of mRNA levels. Calculating accurate mRNA levels requires important parameters such as reaction efficiency and the fractional cycle number at threshold (CT) to be used; however, many algorithms currently in use estimate these important parameters. Here we describe an objective method for quantifying qRT-PCR results using calculations based on the kinetics of individual PCR reactions without the need of the standard curve, independent of any assumptions or subjective judgments which allow direct calculation of efficiency and CT. We use a four-parameter logistic model to fit the raw fluorescence data as a function of PCR cycles to identify the exponential phase of the reaction. Next, we use a three-parameter simple exponent model to fit the exponential phase using an iterative nonlinear regression algorithm. Within the exponential portion of the curve, our technique automatically identifies candidate regression values using the P-value of regression and then uses a weighted average to compute a final efficiency for quantification. For CT determination, we chose the first positive second derivative maximum from the logistic model. This algorithm provides an objective and noise-resistant method for quantification of qRT-PCR results that is independent of the specific equipment used to perform PCR reactions.


Figures

FIG. 1
FIG. 1
Flow chart showing steps in implementing the algorithm described. The process of quantification includes exponential phase determination, efficiency estimation, CT calculation, and comparison among samples. R0 is the start template concentration; E represents the efficiency of the PCR reaction.
FIG. 2
FIG. 2
Fitting the whole curve and determining the exponential phase. The fluorescent data from a typical sample in this study (filled circles) are plotted. (A) Four four-parameter S-shaped models, Logistic (red), Sigmoid (blue), Gompertz (brown), and Chapman (purple) model together with an ideal three-parameter simple exponent model (dashed line) were fitted to the PCR kinetic curve. The symbol a is the difference between the maximum fluorescence and the ground fluorescence; y0 is the ground fluorescence. Inset: Magnified view of the exponential phase between SPE and EPE. (B) Determining the start point. The plot of sample in (A) is expanded to allow visualization of the ground phase. When the baseline is calculated from the entire ground phase including two points (blue) with higher noise, a later outlier is identified as the start point of exponential phase (blue arrow). The efficiency calculated by this method is an overestimation (E = 1.397, blue) when compared with the efficiency estimated by standard curve (Estd = 0.9747). After deletion of the high noise cycles based on subjective judgment, a refined baseline (red) identifies an earlier outlier and generates an improved efficiency estimate (E = 0.936, red). Our noise level based SPE algorithm defined the start point without making assumptions about the baseline, which resulted in a closer efficiency (E = 0.942, black arrow) to Estd even from this single reaction. Using this method, the final averaged efficiency for this gene (EMiner = 0.9630) is very close to the efficiency estimated by the standard curve method. (C) UBS and OBS: UBS (red) will result when cycles with high noise in the ground phase exist on the upper side of the ideal baseline (dashed line), resulting in subtracting smaller values for later cycles after the ground phase. In the opposite, OBS (blue) due to the existence of the points with high noise on the lower side of the ideal baseline results in subtracting too much for later cycles after the ground phase. The sample is the same as used in (B).
FIG. 3
FIG. 3
Comparison of linear regression versus nonlinear regression. (A) Equations for linear regression. R0 is the initial fluorescence; Rn is the fluorescence after n cycles, n is the cycle number, and E is the efficiency. Ln is the nature logarithm, and e is the base of the nature logarithm. (B) Equations for nonlinear regression. Here y0 is the baseline of the EP.
FIG. 4
FIG. 4
Evaluation of noise-resistant regression. The same data in Table 5 were plotted. Note that the noise SPE weighted efficiency is most accurate. The bars are the means ± standard deviations (SD), *P(t) < 0.05; **P(t) < 0.01.
FIG. 5
FIG. 5
Comparison of methods for CT determination. (A) CT determination using FDM, SDM, and mid-value point. The same sample as in Fig. 2 was used. Inset shows the same sample plotted with a logarithmic scale. (B) The Taqman threshold, FDM, SDM, and mid-value point methods were used to determine CT. The results computed by these methods from the same samples used in Table 6 were compared to the values generated by the known serial dilutions (solid line).
FIG. 6
FIG. 6
Validation of real-time PCR Miner. Multiple internal control genes (actin, G3PDH, and 18S rRNA) were used to normalize the PCNA expression level over 24 hours. The geometric average of these reference genes was used for normalization. Data were analyzed by standard curve calculated by Taqman CTs (Taqman-Std), SDM CTs (SDM-Std), and Miner. The bars are the means ± standard errors (SE) of at least four independent experiments (n ≥ 4) in triplicates. The results generated by Miner most closely match those generated by two standard curve methods.

References

    1. Bar T, Stahlberg A, Muszta A, Kubista M. Kinetic outlier detection (KOD) in real-time PCR. Nucl. Acids Res. 2003;31:e105. - PMC - PubMed
    1. Bustin SA. Absolute quantification of mRNA using real-time reverse transcription polymerase chain reaction assays. J. Mol. Endocrinol. 2000;25:169–193. - PubMed
    1. Bustin SA. Quantification of mRNA using real-time reverse transcription PCR (RT-PCR): Trends and problems. J. Mol. Endocrinol. 2002;29:23–39. - PubMed
    1. Chiu JF, Mack AF, Fernald RD. Daily rhythm of cell proliferation in the teleost retina. Brain Res. 1995;673:119–125. - PubMed
    1. Fernald RD. Quantitative behavioural observations of Haplochromis burtoni under semi-natural conditions. Anim. Behav. 1977;25:643–653.

Publication types

LinkOut - more resources