

Homologous versus heterologous interactions in the bicomponent staphylococcal gamma-haemolysin pore
- PMID: 16241903
- PMCID: PMC1386019
- DOI: 10.1042/BJ20051210
Homologous versus heterologous interactions in the bicomponent staphylococcal gamma-haemolysin pore
Abstract
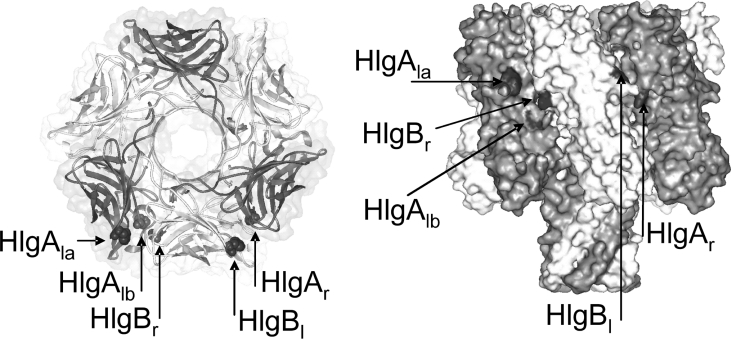
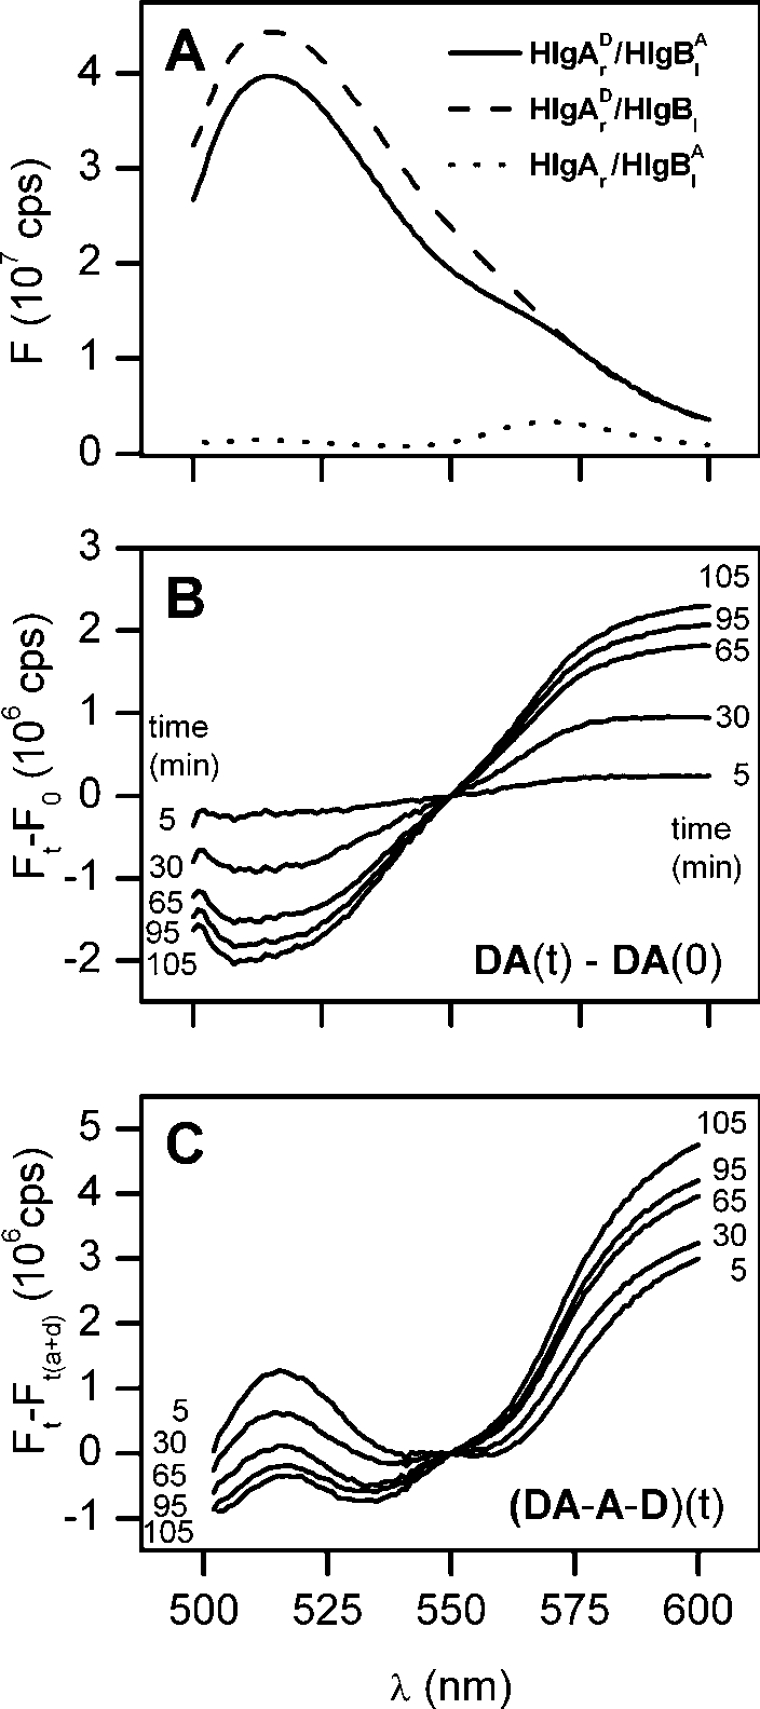
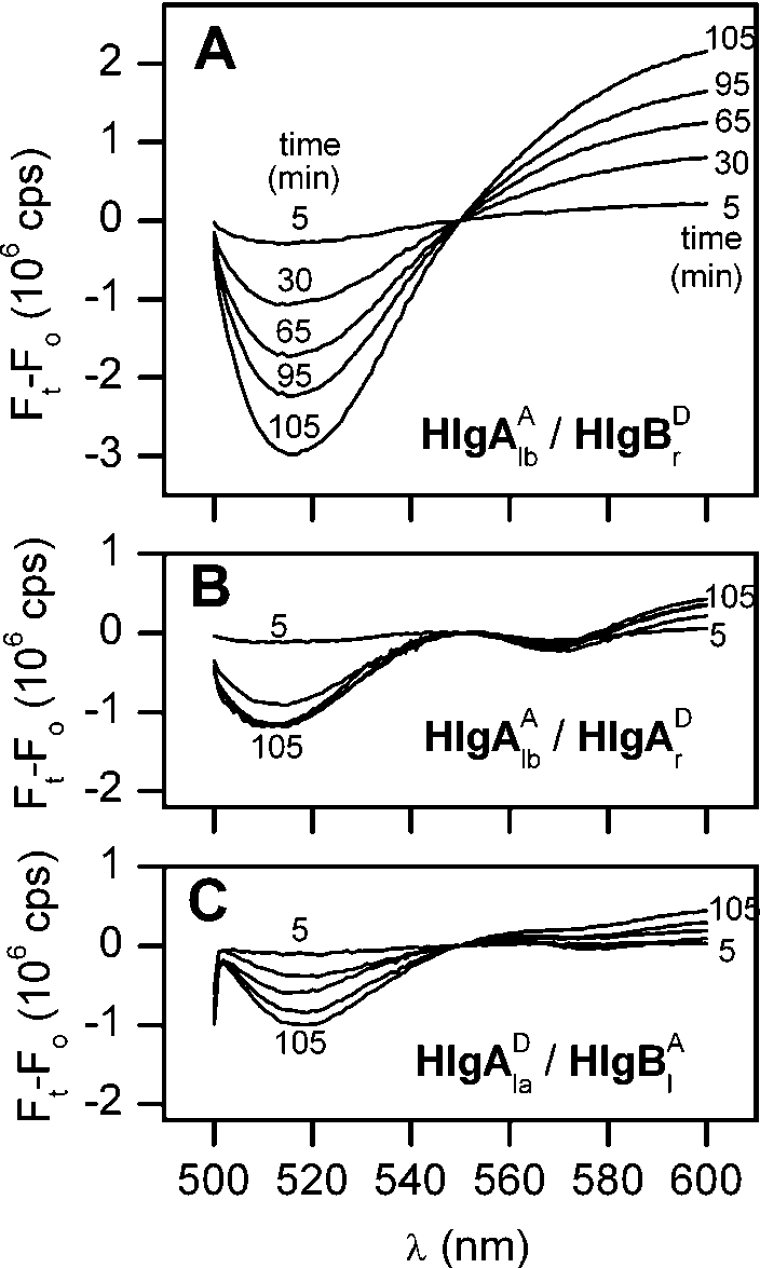
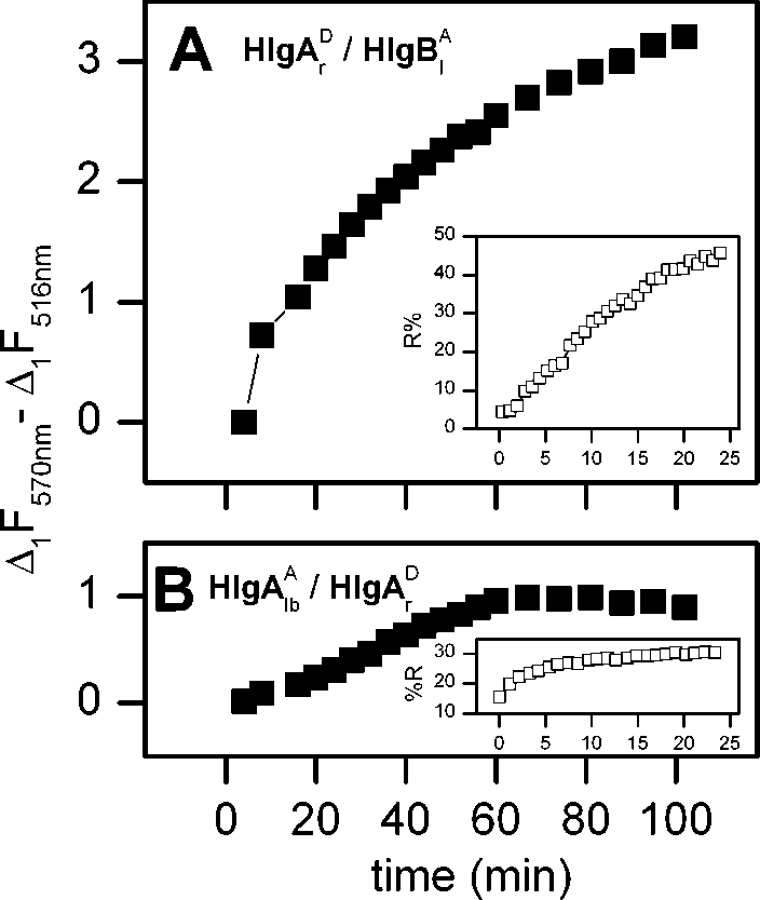
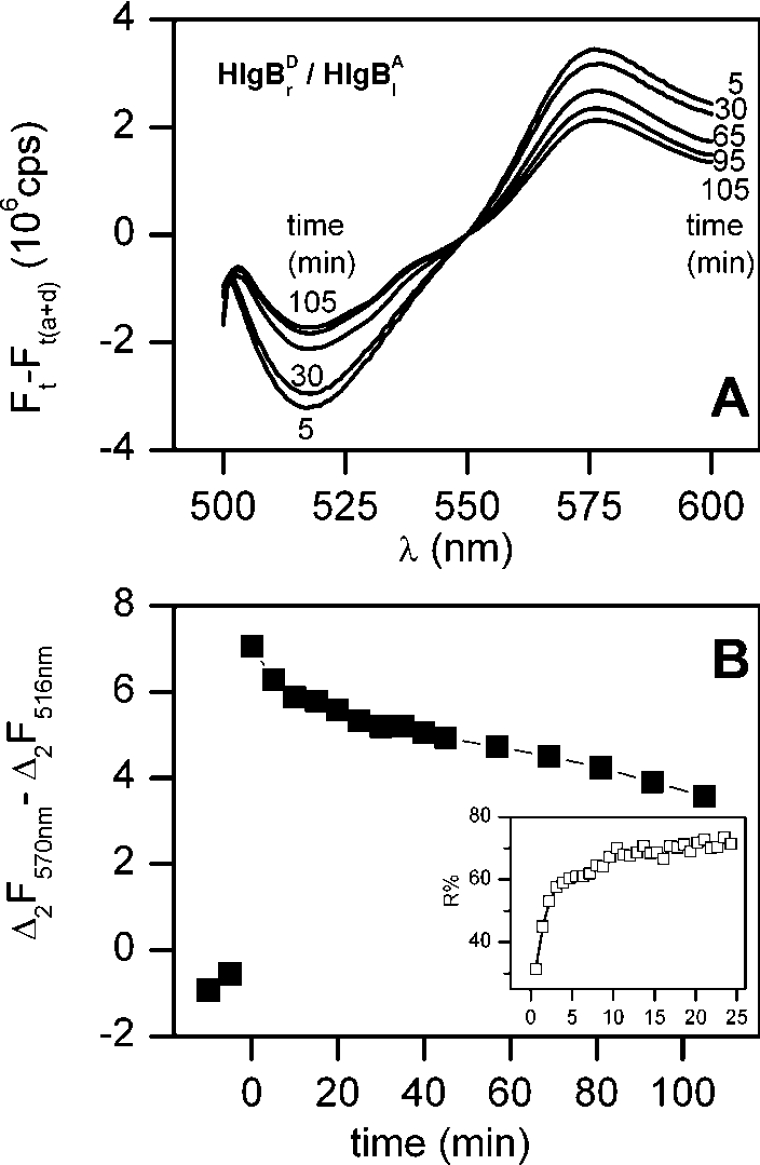
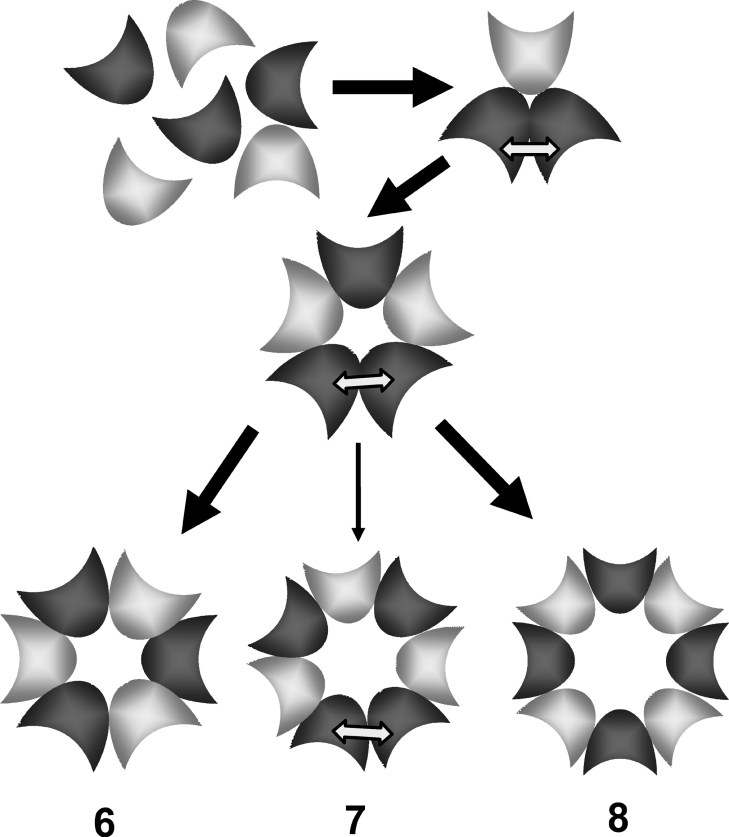
Staphylococcal gamma-haemolysin HlgA-HlgB forms a beta-barrel transmembrane pore in cells and in model membranes. The pore is formed by the oligomerization of two different proteins and a still debated number of monomers. To clarify the topology of the pore, we have mutated single residues - placed near the right and left interfaces of each monomer into cysteine. The mutants were labelled with fluorescent probes, forming a donor-acceptor pair for FRET (fluorescence resonance energy transfer). Heterologous couples (labelled on complementary left and right interfaces) displayed a marked FRET, suggesting extensive HlgA-HlgB or HlgB-HlgA contacts. Heterologous control couples (with both components labelled on the same side) showed absent or low FRET. We found the same result for the homologous couple formed by HlgA [i.e. HlgA-HlgA in the presence of wt (wild-type) HlgB]. The homologous HlgB couple (HlgB-HlgB labelled on left and right interfaces and in the presence of wt HlgA) displayed a transient, declining FRET, which may indicate fast formation of an intermediate that is consumed during pore formation. We conclude that bicomponent pores are assembled by alternating heterologous monomers.
Figures
Similar articles
-
Engineered covalent leucotoxin heterodimers form functional pores: insights into S-F interactions.Biochem J. 2006 Jun 1;396(2):381-9. doi: 10.1042/BJ20051878. Biochem J. 2006. PMID: 16494579 Free PMC article.
-
Protein engineering modulates the transport properties and ion selectivity of the pores formed by staphylococcal gamma-haemolysins in lipid membranes.Mol Microbiol. 2002 Jun;44(5):1251-67. doi: 10.1046/j.1365-2958.2002.02943.x. Mol Microbiol. 2002. PMID: 12068809
-
The interaction of Staphylococcus aureus bi-component gamma-hemolysins and leucocidins with cells and lipid membranes.Biochim Biophys Acta. 1998 Nov 11;1414(1-2):108-26. doi: 10.1016/s0005-2736(98)00160-6. Biochim Biophys Acta. 1998. PMID: 9804914
-
Ion channels and bacterial infection: the case of beta-barrel pore-forming protein toxins of Staphylococcus aureus.FEBS Lett. 2003 Sep 18;552(1):54-60. doi: 10.1016/s0014-5793(03)00850-0. FEBS Lett. 2003. PMID: 12972152 Review.
-
Staphylococcal pore-forming toxins.Curr Top Microbiol Immunol. 2001;257:53-83. doi: 10.1007/978-3-642-56508-3_4. Curr Top Microbiol Immunol. 2001. PMID: 11417122 Review. No abstract available.
Cited by
-
Incoming new IUPAB Councilor 2021-Gabriella Viero.Biophys Rev. 2021 Oct 29;13(6):845-847. doi: 10.1007/s12551-021-00861-2. eCollection 2021 Dec. Biophys Rev. 2021. PMID: 35059004 Free PMC article. No abstract available.
-
Crystallization and preliminary crystallographic studies of both components of the staphylococcal LukE-LukD leukotoxin.Acta Crystallogr Sect F Struct Biol Cryst Commun. 2012 Jun 1;68(Pt 6):663-7. doi: 10.1107/S1744309112014662. Epub 2012 May 23. Acta Crystallogr Sect F Struct Biol Cryst Commun. 2012. PMID: 22684065 Free PMC article.
-
Engineered covalent leucotoxin heterodimers form functional pores: insights into S-F interactions.Biochem J. 2006 Jun 1;396(2):381-9. doi: 10.1042/BJ20051878. Biochem J. 2006. PMID: 16494579 Free PMC article.
-
Distinction between pore assembly by staphylococcal alpha-toxin versus leukotoxins.J Biomed Biotechnol. 2007;2007(1):25935. doi: 10.1155/2007/25935. Epub 2007 Feb 28. J Biomed Biotechnol. 2007. PMID: 17497023 Free PMC article.
-
The bicomponent pore-forming leucocidins of Staphylococcus aureus.Microbiol Mol Biol Rev. 2014 Jun;78(2):199-230. doi: 10.1128/MMBR.00055-13. Microbiol Mol Biol Rev. 2014. PMID: 24847020 Free PMC article. Review.
References
-
- Tenover F. C. Development and spread of bacterial resistance to antimicrobial agents: an overview. Clin. Infect. Dis. 2001;33:S108–S115. - PubMed
-
- Astagneau P., Fleury L., Leroy S., Lucet J. C., Golliot F., Regnier B., Brucker G. Cost of antimicrobial treatment for nosocomial infections based on a French prevalence survey. J. Hosp. Infect. 1999;42:303–312. - PubMed
-
- Menestrina G., Dalla Serra M., Prévost G. Mode of action of beta-barrel pore-forming toxins of the staphylococcal gamma-hemolysin family. Toxicon. 2001;39:1661–1672. - PubMed
-
- Prévost G. Toxins in Staphylococcus aureus pathogenesis. In: Thomas P., editor. Microbial Toxins: Molecular and Cellular Biology. Norfolk, U.K.: Horizon Bioscience; 2005. pp. 243–283.
Publication types
MeSH terms
Substances
LinkOut - more resources
Full Text Sources